
Cost-Volume-Profit (CVP) Analysis: Formula and Examples

Cost volume profit analysis (CVP analysis) examines how selling prices, sales volume, variable costs, and fixed costs affect operating profit. The core formula is: Operating profit = (Selling price per unit − Variable cost per unit) × Units sold − Fixed costs. Break-even units = Fixed costs ÷ Contribution margin per unit (price minus variable cost per unit).
Managers use CVP analysis to calculate break-even sales, estimate profit at different activity levels, and find the sales needed to reach a profit target. It also shows up on professional exams: CVP is part of the Business Analysis and Reporting (BAR) section of the CPA exam, developed by the AICPA, and the Business Decision Analysis section of CMA Part 2, offered by the IMA.
The central idea is simple: each sale first covers its variable costs. The amount left over, called contribution margin, helps cover fixed costs. Once total contribution margin exceeds fixed costs, the business earns operating profit. The contribution margin ratio expresses contribution margin as a percentage of sales.
Watch the CVP Analysis Lecture
Prefer to learn by watching? In this lecture, Professor Farhat works through the same Adam Electronics example, from contribution margin to break-even and profit above break-even.
Jump to a part of the video:
- 0:00 What is cost-volume-profit analysis?
- 0:30 Variable costs vs. fixed costs
- 3:35 Contribution margin per unit
- 6:01 Worked example: Adam Electronics
- 9:27 Calculating break-even: 400 tablets
- 11:46 Applying the formula at 440 units
- 12:22 Simplifying assumptions in CVP analysis
CVP Formula: How to Calculate Operating Profit
Operating profit = Sales revenue − Variable costs − Fixed costs
For one product, the same CVP formula can be written as:
Operating profit = (Selling price per unit − Variable cost per unit) × Units sold − Fixed costs
In symbols: Operating profit = (P − V) × Q − F, where P is selling price per unit, V is variable cost per unit, Q is units sold, and F is total fixed costs for the period.
Contribution margin per unit = P − V. Therefore, operating profit also equals contribution margin per unit × units sold − fixed costs. Use the per-unit contribution margin when multiplying by units; total contribution margin has already incorporated volume.
Worked CVP Analysis Example: Adam Electronics
Adam Electronics sells 500 tablets in December for $500 each. Variable costs are $300 per tablet, and December fixed costs are $80,000. What is Adam’s operating profit, and how many tablets must it sell to break even?
Step 1: Find Contribution Margin
Each tablet contributes $500 − $300 = $200 toward fixed costs and profit. The contribution margin ratio is $200 ÷ $500 = 40%. This means 40 cents of each sales dollar remains after variable costs.
Step 2: Calculate Operating Profit
Operating profit = ($500 − $300) × 500 − $80,000 = $20,000
| December income statement | Calculation | Amount |
|---|---|---|
| Sales revenue | 500 × $500 | $250,000 |
| Less variable costs | 500 × $300 | ($150,000) |
| Contribution margin | 500 × $200 | $100,000 |
| Less fixed costs | Monthly total | ($80,000) |
| Operating profit | $100,000 − $80,000 | $20,000 |
Step 3: Calculate the Break-Even Point
At break-even, operating profit is zero because total contribution margin exactly covers fixed costs.
Break-even units = Fixed costs ÷ Contribution margin per unit
For Adam: $80,000 ÷ $200 = 400 tablets.
Break-even sales dollars = Fixed costs ÷ Contribution margin ratio
For Adam: $80,000 ÷ 0.40 = $200,000. This also equals 400 tablets × $500.
Step 4: Compare Sales Scenarios
With prices and costs unchanged, every additional tablet sold increases operating profit by $200. At 500 tablets, Adam sells 100 tablets above break-even: 100 × $200 = $20,000 of profit.
- 400 tablets: ($200 × 400) − $80,000 = $0 profit.
- 440 tablets: ($200 × 440) − $80,000 = $8,000 profit.
- 500 tablets: ($200 × 500) − $80,000 = $20,000 profit.
Common mistake: reporting $88,000 as Adam’s profit at 440 tablets. That $88,000 is total contribution margin. Subtract the $80,000 of fixed costs and operating profit is only $8,000.
Cost Volume Profit Analysis Graph
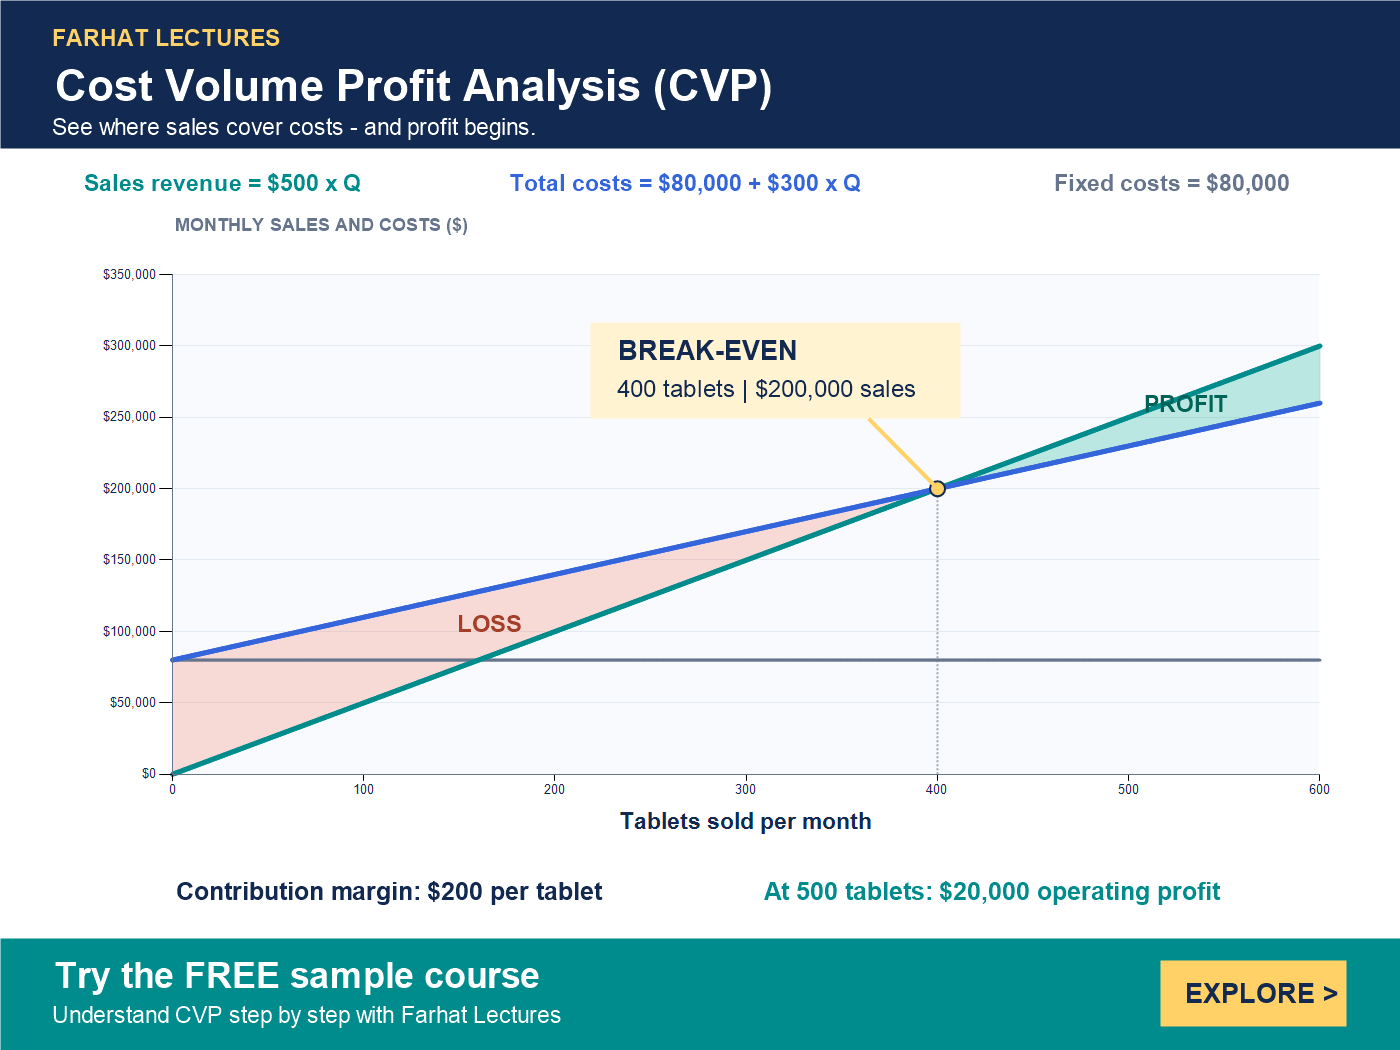
The graph shows the same cost volume profit relationships as the calculations above. Sales revenue starts at zero, while total costs start at $80,000 of fixed costs. The lines cross at break-even. To the right of that point, sales exceed total costs and the gap represents operating profit.
What Are the Components of Cost Volume Profit Analysis?
- Selling price: revenue earned per unit sold. A price change affects contribution margin and may also affect customer demand.
- Variable costs: costs that change in total with activity, such as the cost of tablets purchased for resale. CVP assumes variable cost per unit stays constant within the relevant range, which is the band of activity where the company’s cost behavior holds.
- Fixed costs: costs that stay constant in total within a specified activity range and time period, such as monthly rent. Fixed cost per unit falls as volume rises.
- Sales volume: the number of units sold. Use sales volume, not unsold production, when calculating revenue.
- Operating profit: the amount left after variable and fixed operating costs. It is measured before interest and income taxes.
Using CVP Analysis to Reach a Target Profit
To find the required sales volume for a desired operating profit, rearrange the CVP equation:
Required units = (Fixed costs + Target operating profit) ÷ Contribution margin per unit
For a sales-dollar answer, divide the same numerator by the contribution margin ratio. A target profit of zero gives the break-even formula. See the target profit formula with worked examples for a complete before-tax and after-tax walkthrough.
For example, if Adam wants $30,000 of operating profit in December, it needs ($80,000 + $30,000) ÷ $200 = 550 tablets. In sales dollars, that is $110,000 ÷ 0.40 = $275,000, which matches 550 tablets × $500.
How Far Can Sales Fall? Margin of Safety and Operating Leverage
The margin of safety tells you how much sales can drop before the business starts losing money. It compares actual (or budgeted) sales with break-even sales.
Margin of safety = Actual sales − Break-even sales
For Adam: $250,000 − $200,000 = $50,000, which is the same as 500 − 400 = 100 tablets.
Margin of safety ratio = Margin of safety ÷ Actual sales
For Adam: $50,000 ÷ $250,000 = 20%. December sales could fall 20% before Adam reaches break-even.
The degree of operating leverage (DOL) measures how sensitive operating profit is to a change in sales. It is always calculated at a specific sales level.
Degree of operating leverage = Total contribution margin ÷ Operating profit
For Adam at 500 tablets: $100,000 ÷ $20,000 = 5.0. That means a 10% increase in sales raises operating profit by 50%. Check it: at 550 tablets, contribution margin is $110,000 and operating profit is $110,000 − $80,000 = $30,000, which is 50% more than $20,000.
Above break-even, DOL always equals 1 ÷ margin of safety ratio. For Adam, 1 ÷ 0.20 = 5.0. For full walkthroughs, see the margin of safety formula and examples and the degree of operating leverage guide.
How Do Price and Cost Changes Affect Break-Even?
CVP analysis really pays off when you ask “what if?” Change one input at a time, recalculate contribution margin per unit, and divide fixed costs by the new contribution margin. Here is what happens to Adam’s break-even point:
| Change (one at a time) | Contribution margin per tablet | Break-even tablets |
|---|---|---|
| Base case | $500 − $300 = $200 | $80,000 ÷ $200 = 400 |
| Price rises to $520 | $520 − $300 = $220 | $80,000 ÷ $220 = 363.6, rounded up to 364 |
| Variable cost rises to $320 | $500 − $320 = $180 | $80,000 ÷ $180 = 444.4, rounded up to 445 |
| Fixed costs rise to $90,000 | $500 − $300 = $200 | $90,000 ÷ $200 = 450 |
Notice that a $20 price increase and a $20 variable cost increase move break-even in opposite directions, but not by the same number of tablets (36 fewer versus 45 more). Break-even depends on the size of the contribution margin, not just the dollar change.
Quick Practice Question
A rent increase pushes Adam’s monthly fixed costs to $86,000. Price stays at $500 and variable cost stays at $300 per tablet. How many tablets must Adam sell to earn $20,000 of operating profit?
Answer: ($86,000 + $20,000) ÷ $200 = 530 tablets. Check: 530 × $200 = $106,000 of contribution margin, minus $86,000 of fixed costs, leaves $20,000 of operating profit.
CVP Assumptions and Limitations
Cost volume profit analysis is a planning model. Its results depend on the assumptions used:
- Selling price and variable cost per unit remain constant within each scenario.
- Total fixed costs remain constant within the relevant range. Expanding capacity may require a new fixed-cost estimate.
- Costs can be separated into fixed and variable components, including the components of mixed costs.
- For multiple products, the sales mix remains constant.
- Manufacturing examples generally assume production equals sales, so inventory levels do not change.
Use costs and sales for the same period, express percentages as decimals in calculations, and round required whole units up. A positive contribution margin is needed to cover positive fixed costs. CVP estimates what happens if the inputs hold; it does not predict demand.
Exam Tips: Common CVP Mistakes
Watch for these slips on CPA and CMA practice questions:
- Dividing by total contribution margin. The break-even formula uses contribution margin per unit ($200), not total contribution margin ($100,000).
- Calling contribution margin “profit.” At 440 tablets, $88,000 is contribution margin. Operating profit is $8,000.
- Rounding break-even units down. If the math gives 363.6 tablets, the answer is 364. Selling 363 still leaves a small loss.
- Forgetting to gross up an after-tax target. Divide the after-tax target by (1 − tax rate) before adding it to fixed costs.
- Treating fixed cost per unit as a variable cost. Fixed cost per unit changes every time volume changes, so leave it out of contribution margin.
- Mixing time periods. Pair monthly fixed costs with monthly sales, or annual with annual.
Key Takeaways
- Contribution margin per unit = Selling price per unit − Variable cost per unit. For Adam: $500 − $300 = $200.
- Operating profit = Contribution margin per unit × Units sold − Fixed costs. At 500 tablets: $200 × 500 − $80,000 = $20,000.
- Break-even units = Fixed costs ÷ Contribution margin per unit = $80,000 ÷ $200 = 400 tablets.
- Break-even sales dollars = Fixed costs ÷ Contribution margin ratio = $80,000 ÷ 0.40 = $200,000.
- Units for a target profit = (Fixed costs + Target operating profit) ÷ Contribution margin per unit.
- Margin of safety = Actual sales − Break-even sales = $250,000 − $200,000 = $50,000, or 20% of sales.
- CVP results hold only within the relevant range and under the model’s assumptions.
Frequently Asked Questions About CVP Analysis
Is CVP analysis the same as break-even analysis?
Break-even analysis is one part of CVP analysis. It finds the sales level where profit is zero. CVP also evaluates target profit and the effects of changing prices, costs, or sales volume.
Is contribution margin the same as profit?
No. Contribution margin equals sales minus variable costs. Operating profit equals total contribution margin minus fixed costs. In Adam’s example, $100,000 of contribution margin leaves $20,000 of operating profit.
Does the CVP formula calculate after-tax profit?
The basic formula calculates operating profit before interest and taxes. In a simplified example with no nonoperating items, convert an after-tax target to a pretax target by dividing it by (1 − tax rate), then use the target-profit formula. For example, if Adam wants $24,000 of after-tax profit and its tax rate is 25%, the pretax target is $24,000 ÷ (1 − 0.25) = $32,000. Adam then needs ($80,000 + $32,000) ÷ $200 = 560 tablets.
Can CVP analysis be used for several products?
Yes. Use an appropriate weighted-average contribution margin based on the expected sales mix. If that mix changes, recalculate break-even and target sales because the products may contribute different amounts toward fixed costs.
For example, suppose Adam also sells keyboards for $100 each with a $40 variable cost, so each keyboard contributes $60. Adam expects to sell 2 keyboards with every tablet, and total fixed costs for both products are $96,000. Treat 1 tablet plus 2 keyboards as one bundle. Contribution margin per bundle = $200 + (2 × $60) = $320. Break-even = $96,000 ÷ $320 = 300 bundles, which means 300 tablets and 600 keyboards.
Is CVP analysis tested on the CPA and CMA exams?
Yes. CPA candidates see CVP in the Business Analysis and Reporting (BAR) section, and CMA candidates see it in the Business Decision Analysis section of Part 2. Typical questions ask for break-even units or sales dollars, the sales needed for a target profit, the margin of safety, or the effect of a price or cost change.
What is the relevant range in CVP analysis?
The relevant range is the band of activity where a company’s cost behavior holds: total fixed costs stay the same, and variable cost per unit stays the same. If Adam had to open a second store to sell far more tablets, its fixed costs would jump, and you would redo the CVP analysis with the new numbers.
How is a contribution margin income statement different from a traditional income statement?
A contribution margin income statement subtracts variable costs from sales first and fixed costs second, like Adam’s December income statement above. That is the layout CVP analysis needs. A traditional income statement subtracts cost of goods sold, which for a manufacturer mixes fixed and variable production costs, and it groups other expenses by function, so you cannot read contribution margin or break-even straight from it.
Keep Learning CVP Analysis
These lessons build directly on the Adam Electronics example:
- Contribution margin ratio: calculate and interpret a 40% ratio.
- Target profit formula: before-tax and after-tax targets with practice.
- Margin of safety: how far sales can fall before a loss.
- Degree of operating leverage: how a percentage change in sales affects operating profit.
- Five CVP decision examples: advertising, pricing, commissions, and special orders.
- Cost structure and profit risk: how the mix of fixed and variable costs affects profit and risk.
For another explanation of the assumptions and break-even formulas, see OpenStax’s managerial accounting chapter on break-even analysis.
Preparing for an exam? CPA candidates taking BAR can practice with the BAR test bank, and CMA candidates can explore the CMA Part 2 course. To master the full topic, build your understanding with the Farhat Lectures Managerial Accounting course, or try the free sample course to explore the lessons.
About the Author
Mansour Farhat, DBA, CPA, CIA, is the founder of Farhat Lectures and a veteran accounting educator who helps students and CPA, CMA, and EA candidates understand the reasoning behind the numbers. He holds a Doctor of Business Administration from Temple University and a Master of Accountancy from Bloomsburg University. Learn more about Professor Farhat.





Responses