
Contribution Margin Ratio: Formula and 2 Worked Examples


The contribution margin ratio is the share of each sales dollar left after variable costs, available to cover fixed costs and then provide operating profit. Contribution margin ratio = (Sales − Variable costs) ÷ Sales. If a $10 item has $6 of variable costs, the ratio is $4 ÷ $10 = 40%, so every sales dollar contributes $0.40 toward fixed costs and profit.
A 40% ratio does not mean a 40% profit margin. Fixed costs still have to be deducted from total contribution margin. The examples below show how to move from a sales percentage to an operating-profit amount.
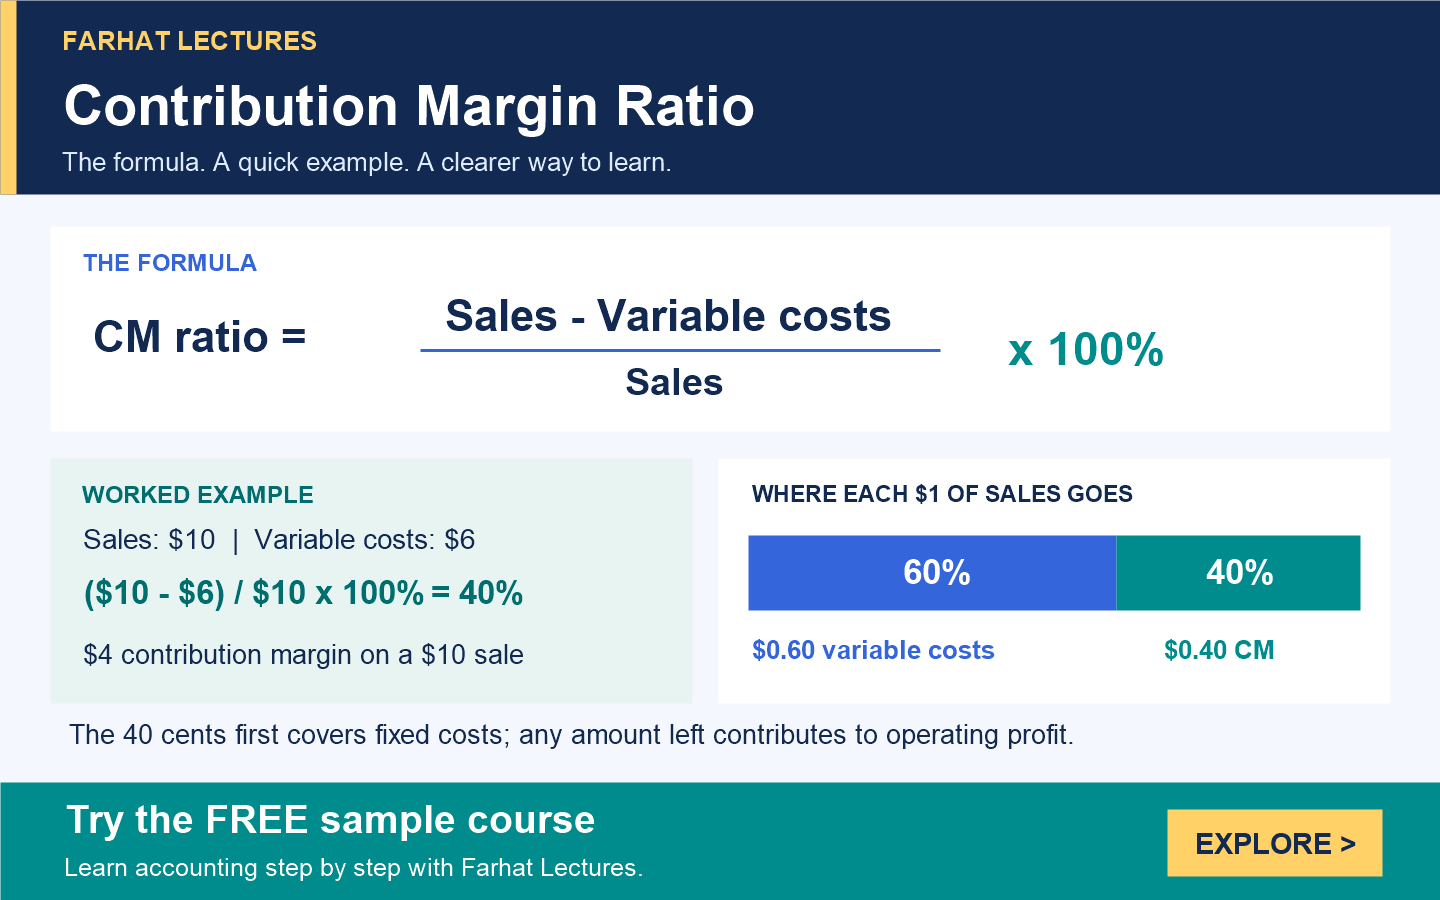
Contribution Margin Ratio Formula: How to Calculate It
Quick refresher on the two cost types. Variable costs rise and fall in total with the number of units you sell, like materials or a sales commission on each sale. Fixed costs stay the same in total within your normal range of activity (accountants call this the relevant range), like rent or salaries. If you’d like a deeper review, see our cost behavior lesson.
You can calculate the ratio using totals for the same period or per-unit amounts for a single product:
- Total contribution margin = Sales revenue − Total variable costs
- CM ratio = Total contribution margin ÷ Sales revenue
- CM ratio using per-unit amounts = (Selling price per unit − Variable cost per unit) ÷ Selling price per unit (you get the same answer as the total method)
Multiply the decimal answer by 100 to express it as a percentage. When using the ratio in a profit calculation, enter 0.40 for 40%. Include all variable operating costs, such as variable selling commissions, rather than only the purchase or manufacturing cost of the product.
What Is the Difference Between Contribution Margin and the Contribution Margin Ratio?
Contribution margin is a dollar amount. The contribution margin ratio is the same idea expressed as a percentage of sales.
In Example 1 below, the contribution margin is $4 per unit and the contribution margin ratio is 40%. Both describe the same sale, just in different units.
Here’s a quick way to choose between them on an exam:
- Use contribution margin per unit when the question is about units, such as “How many units must we sell to break even?”
- Use the contribution margin ratio when the question is about sales dollars, such as “What sales revenue do we need?” or “How much will profit rise if sales grow by $50,000?”
Some textbooks, especially outside the United States, call this ratio the profit-volume (P/V) ratio. It’s the same calculation.
Example 1: Calculate the Ratio on a $10 Sale
A business sells one item for $10 and incurs total variable costs of $6 per item. Calculate its contribution margin ratio in three steps:
- Subtract variable costs: $10 − $6 = $4 contribution margin per unit.
- Divide by the selling price: $4 ÷ $10 = 0.40.
- Convert to a percentage: 0.40 × 100% = 40%.
The variable expense ratio is $6 ÷ $10 = 60%. The two percentages add to 100%: 60% variable costs + 40% contribution margin. Equivalently, the CM ratio equals 1 minus the variable expense ratio when both are expressed as decimals.
Example 2: Adam Electronics Contribution Margin Income Statement
Adam Electronics sells tablets for $500 each, with $300 in variable costs per tablet and $80,000 of fixed costs for the month. Assume selling price, variable cost per unit, and monthly fixed costs remain unchanged as sales rise from 400 to 500 tablets.
At 400 tablets, sales are 400 × $500 = $200,000 and variable costs are 400 × $300 = $120,000. The contribution margin ratio is ($200,000 − $120,000) ÷ $200,000 = 0.40, or 40%. The per-unit calculation gives the same answer: ($500 − $300) ÷ $500 = 40%.
| Contribution margin income statement | 400 tablets | 500 tablets |
|---|---|---|
| Sales revenue | $200,000 | $250,000 |
| Less variable costs | ($120,000) | ($150,000) |
| Contribution margin | $80,000 | $100,000 |
| Contribution margin ratio | 40% | 40% |
| Less fixed costs | ($80,000) | ($80,000) |
| Operating profit | $0 | $20,000 |
Predict the Change in Operating Profit
Selling 100 more tablets adds $50,000 of revenue. With the same ratio and unchanged fixed costs, the increase in operating profit is $50,000 × 0.40 = $20,000. The ratio stays at 40%; total contribution margin rises because sales increase.
Operating profit = (Sales revenue × CM ratio) − Fixed costs
At 500 tablets: ($250,000 × 0.40) − $80,000 = $20,000.
For a change between two scenarios, use Change in operating profit = (Change in sales × CM ratio) − Change in fixed costs, provided the ratio remains constant. If a sales increase requires extra advertising or capacity, include the additional fixed costs instead of assuming the entire increase in contribution margin becomes profit.
Watch the Contribution Margin Ratio Lecture
Professor Farhat explains the formula, the variable expense ratio, and profit predictions using tablet-sales examples. Watch below or open the lecture on YouTube starting at 0:17.
Jump to the part you need:
- 0:52 Calculate a 40% contribution margin ratio
- 2:41 Adam Electronics tablet example
- 4:04 Variable expense ratio
- 6:04 Predict profit when tablet sales increase
- 9:54 Practice problem: sales fall to 6,100 units
Practice Problem: Predict Operating Income When Sales Fall
Try this one before you peek at the solution. It’s the same problem Professor Farhat solves in the lecture.
A company sells 6,300 units for total sales of $415,800. Its variable expenses are $289,800, and its fixed expenses are $98,500. What will operating income be if sales fall to 6,100 units? Assume the selling price, variable cost per unit, and total fixed expenses don’t change.
Solution
- Selling price per unit: $415,800 ÷ 6,300 = $66
- Variable cost per unit: $289,800 ÷ 6,300 = $46
- Contribution margin per unit: $66 − $46 = $20
- Contribution margin at 6,100 units: 6,100 × $20 = $122,000
- Operating income: $122,000 − $98,500 = $23,500
You can check the answer with the ratio. The contribution margin ratio is $20 ÷ $66, or about 30.3%. Sales at 6,100 units are 6,100 × $66 = $402,600, and $402,600 × ($20 ÷ $66) − $98,500 = $23,500.
Watch for two traps. First, $122,000 is contribution margin, not operating income, so don’t stop before subtracting fixed expenses. Second, if you round the ratio to 30.3% too early, you get $402,600 × 0.303 = $121,987.80 of contribution margin and $23,487.80 of operating income. Keep the unrounded ratio until the final step.
Prefer to watch? The worked solution starts at 9:54 in the lecture.
How Do You Use the Contribution Margin Ratio for Break-Even and Target Profit?
The contribution margin ratio helps convert fixed costs and profit targets into required sales dollars. For Adam, break-even sales = $80,000 ÷ 0.40 = $200,000. At that sales level, contribution margin covers fixed costs and operating profit is zero.
Break-even also tells you how much cushion you have. At 500 tablets, Adam’s sales of $250,000 are $50,000 above break-even, so sales could fall 20% ($50,000 ÷ $250,000) before the company starts losing money. That cushion is called the margin of safety, and our margin of safety guide walks through it step by step.
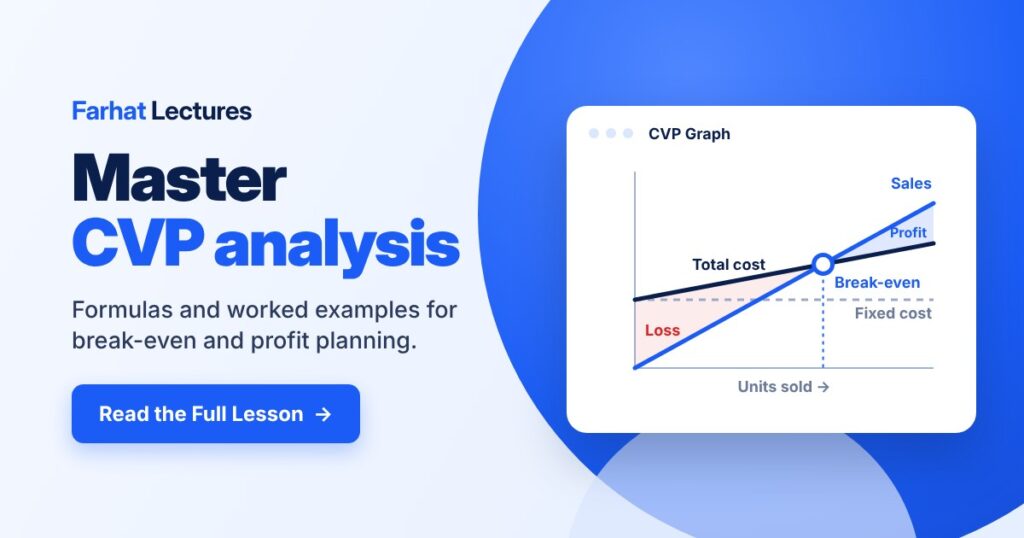
For a positive target operating profit, use Required sales dollars = (Fixed costs + Target operating profit) ÷ CM ratio. For example, if Adam wants $30,000 of operating profit, it needs ($80,000 + $30,000) ÷ 0.40 = $275,000 of sales, which is 550 tablets. You can practice more of these in our target profit formula guide. See our cost-volume-profit (CVP) analysis article for the unit-based formulas and break-even graph.
Connect Contribution Margin to Operating Leverage
Operating leverage measures how sensitive operating profit is to changes in sales at a given starting sales level. Degree of operating leverage = Total contribution margin ÷ Operating income. Using Adam’s 500-tablet results, $100,000 ÷ $20,000 = 5.
Within the same cost assumptions, a 10% sales increase from that starting point produces a 50% increase in operating income. The measure is undefined at break-even because operating income is zero. Read our explanation of degree of operating leverage to understand why fixed costs magnify both gains and losses.
What Can (and Can’t) the Contribution Margin Ratio Tell You?
A higher contribution margin ratio means more of each sales dollar remains after variable costs. It does not prove that one company earns more profit than another. A business with a 40% ratio may still have lower operating profit than a business with a 30% ratio because their sales volumes and fixed costs differ.
Compare similar products and consistent cost classifications. For several products, calculate the overall ratio as Total contribution margin ÷ Total sales; a simple average of product percentages can be misleading. Forecasts also require a stable sales mix (the share of total sales that comes from each product), or a revised ratio for the expected mix.
Example: The Overall Ratio for Two Products
Say a company has two products:
| Product | Sales | CM ratio | Contribution margin |
|---|---|---|---|
| Product A | $60,000 | 50% | $30,000 |
| Product B | $40,000 | 25% | $10,000 |
| Total | $100,000 | 40% | $40,000 |
The overall ratio is $40,000 ÷ $100,000 = 40%. A simple average of the two percentages, (50% + 25%) ÷ 2 = 37.5%, gives the wrong answer because it ignores that Product A makes up more of the sales.
Now flip the mix to $40,000 of Product A and $60,000 of Product B. Contribution margin becomes $20,000 + $15,000 = $35,000, so the overall ratio drops to 35%, even though neither product’s own ratio changed.
How Can a Business Increase Its Contribution Margin Ratio?
There are three main levers:
- Raise the selling price, as long as customers keep buying.
- Lower variable cost per unit, for example by negotiating with suppliers, cutting waste, or changing commission rates.
- Shift the sales mix toward products with higher ratios.
Cutting fixed costs won’t change the ratio at all. It raises operating profit, but the ratio only looks at sales and variable costs.
Here’s a useful comparison using Adam Electronics. Cutting variable cost by $20 to $280 raises the ratio to $220 ÷ $500 = 44%. Raising the price by $20 to $520 raises it to $220 ÷ $520, about 42.3%. Both moves add $20 of contribution margin per tablet, but the price increase also makes the denominator bigger, so the ratio rises less.
Common Exam Traps With the Contribution Margin Ratio
Contribution margin and break-even questions show up in CMA Part 2 (Decision Analysis) and in the CPA Business Analysis and Reporting (BAR) section. Watch for these mistakes:
- Treating a 40% contribution margin ratio as a 40% profit margin. Fixed costs still have to come out.
- Using cost of goods sold instead of variable costs. That gives you gross margin, not contribution margin.
- Forgetting variable selling and administrative costs, such as sales commissions or shipping on each order.
- Subtracting fixed costs before calculating the ratio. Fixed costs never belong in the ratio.
- Averaging product ratios instead of dividing total contribution margin by total sales.
- Rounding the ratio too early, which throws off your final answer.
- Ranking products by contribution margin ratio when a resource is limited. If machine hours or materials are scarce, rank products by contribution margin per unit of that scarce resource instead.
Key Takeaways
- Contribution margin ratio = (Sales − Variable costs) ÷ Sales. It tells you how many cents of each sales dollar are left for fixed costs and profit.
- A 40% ratio is not a 40% profit margin. Subtract fixed costs to get operating profit.
- If price, variable cost per unit, fixed costs, and sales mix stay the same, the change in operating profit = change in sales × CM ratio.
- Break-even sales dollars = Fixed costs ÷ CM ratio.
- For several products, divide total contribution margin by total sales. Don’t average the percentages.
Frequently Asked Questions
Is contribution margin ratio the same as gross margin?
No. Gross margin subtracts cost of goods sold from revenue. Contribution margin subtracts all variable operating costs. Under absorption costing (the costing method used for external financial statements), cost of goods sold includes fixed manufacturing overhead, while variable selling costs such as sales commissions are reported outside it. So the two measures can differ. To see a contribution-format statement built step by step, open our variable costing income statement lesson.
Do fixed costs affect the contribution margin ratio?
Fixed costs are excluded from the ratio itself. They affect operating profit and the sales needed to break even. Keep them separate from variable costs when calculating the numerator.
Can the contribution margin ratio be negative?
Yes. With positive sales, the ratio is negative when variable costs exceed sales revenue. Under those conditions, each additional sale increases the operating loss unless prices or variable costs change. The ratio cannot be calculated when sales revenue is zero.
What is a good contribution margin ratio?
There is no universal percentage. Evaluate the ratio alongside fixed costs, sales demand, capacity, and product mix. A positive ratio helps cover fixed costs, but sufficient total contribution margin is still needed to earn operating profit.
Does the contribution margin ratio change when sales volume changes?
Not on its own. If the selling price, variable cost per unit, and sales mix stay the same, the ratio stays the same at any volume. In the Adam Electronics table, it’s 40% at both 400 and 500 tablets. Total contribution margin grows with sales, but the percentage doesn’t.
How do you find break-even sales with the contribution margin ratio?
Divide fixed costs by the contribution margin ratio. For Adam Electronics, $80,000 ÷ 0.40 = $200,000 of sales, which is 400 tablets at $500 each.
Where is the contribution margin ratio tested on the CPA and CMA exams?
On the CMA exam, administered by the Institute of Management Accountants (IMA), it falls under Decision Analysis in Part 2, Strategic Financial Management. On the CPA Exam, developed by the AICPA, it appears in the Business Analysis area of the BAR discipline section. Expect break-even, target profit, and “what happens to profit if sales change” questions.
For additional study, see OpenStax’s explanation of contribution margin and its ratio. Ready to keep going? Try the free sample course, or work through the full Managerial Accounting course. Studying for the CMA? See our CMA Part 2 course.
About the Author
Mansour Farhat, DBA, CPA, CIA, is a veteran accounting educator and the founder of Farhat Lectures and its YouTube channel. He holds a Doctor of Business Administration from Temple University and a Master of Accountancy from Bloomsburg University, and he teaches students preparing for accounting courses and the CPA, CMA, and EA exams. Learn more about Professor Farhat.




Responses