
CVP Analysis Examples: 5 Business Decisions Solved Step by Step


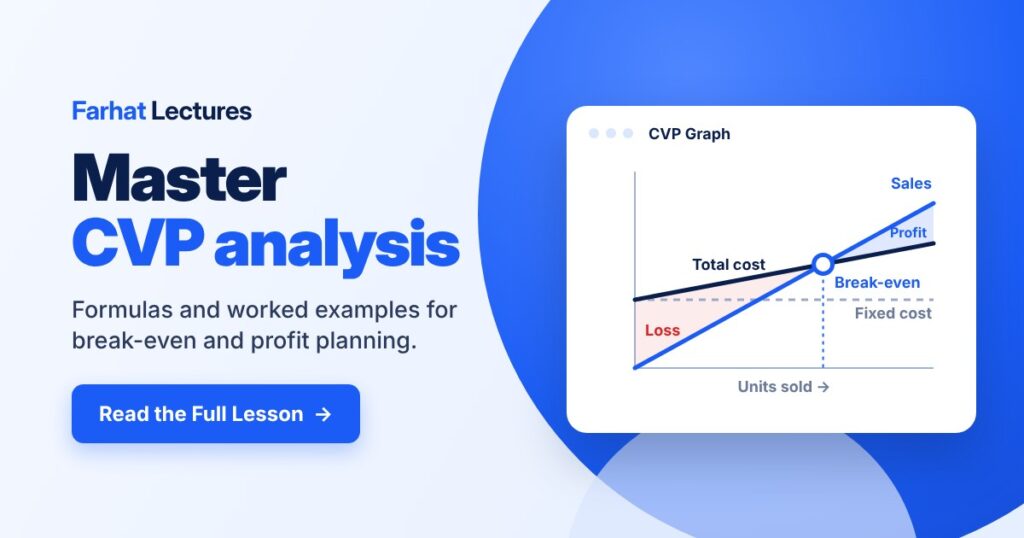
CVP analysis (cost-volume-profit analysis) shows how changes in selling price, sales volume, variable costs, and fixed costs affect operating income. To test any business proposal, compare the change in total contribution margin (sales minus variable costs) with the change in fixed costs. If contribution margin grows by more than fixed costs, operating income rises.
The five CVP analysis examples below apply this rule to advertising, product quality, a price cut, sales commissions, and a special order. Each example starts from the same baseline, so you can compare them fairly. Work through the numbers, then check the results table and the risk check at the end. If you need the basics first, start with Farhat’s CVP analysis formula and break-even guide.
Studying for an exam? CVP analysis shows up on the CPA Exam in the Business Analysis and Reporting (BAR) section, where the AICPA’s blueprint lists breakeven analysis and what-if scenarios. It also appears on the CMA exam in Part 2, where the Institute of Management Accountants (IMA) lists cost-volume-profit analysis under business decision analysis.
Watch: CVP Analysis Examples Explained (15-Minute Video)
Prefer to learn by watching? Professor Farhat walks through all five decisions in this Farhat Lectures lesson using the contribution margin income statement. Watch the lesson below, then use the article’s stated assumptions to work through each calculation.
Jump to the part you need:
- 2:21 Extra advertising
- 4:31 Higher-quality product
- 8:04 Price cut plus advertising
- 10:04 Salary versus commission
- 11:58 Special-order price
Watch Professor Farhat’s CVP application lesson on YouTube.
CVP Analysis: Starting Data and Formulas
Adam Electronics sells tablets for $500 each and incurs $300 in variable costs per tablet. Monthly sales are 500 tablets, and monthly fixed costs are $80,000. These starting amounts follow the Adam Electronics illustration in Farhat’s CVP analysis fundamentals lesson.
| Starting measure | Calculation | Amount |
|---|---|---|
| Selling price per tablet | Given | $500 |
| Variable cost per tablet | Given | $300 |
| Contribution margin per tablet | $500 − $300 | $200 |
| Monthly sales revenue | 500 × $500 | $250,000 |
| Monthly variable costs | 500 × $300 | $150,000 |
| Total contribution margin | $250,000 − $150,000 | $100,000 |
| Monthly fixed costs | Given | $80,000 |
| Monthly operating income | $100,000 − $80,000 | $20,000 |
Evaluate each scenario independently. Return to the original 500-unit baseline for every proposal; do not carry changes from one scenario into the next. Assume sufficient capacity and unchanged costs except for the adjustments specifically stated. In Example 4, the $6,000 salary is already included in the original $80,000 of fixed costs.
Three formulas to use
- Unit contribution margin = Selling price per unit − Variable cost per unit.
- Operating income = Units sold × Unit contribution margin − Total fixed costs.
- Change in operating income = Change in total contribution margin − Change in fixed costs.
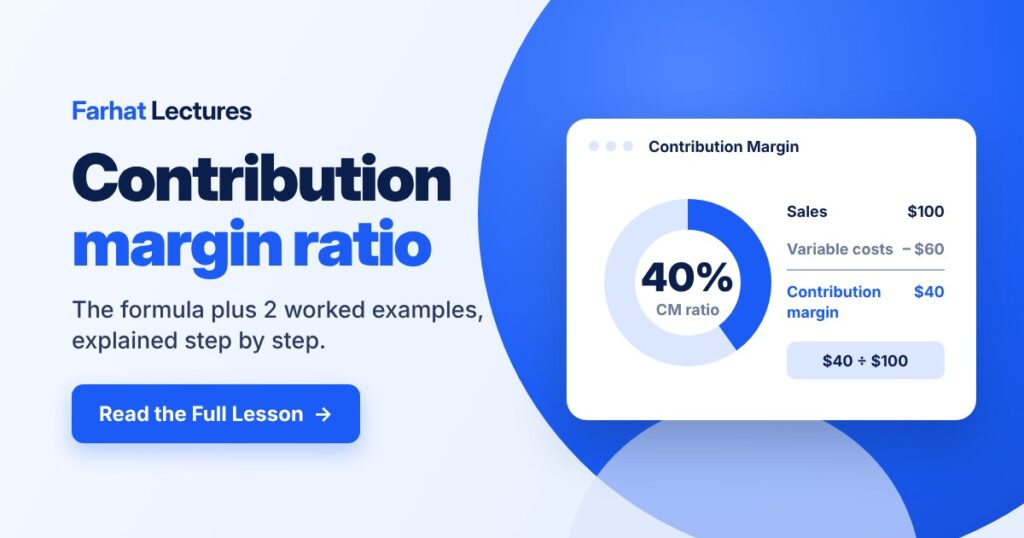
The starting contribution margin ratio is $200 ÷ $500 = 40%. Recalculate the ratio when selling price or variable cost per unit changes. Contribution margin is not operating income because fixed costs still need to be deducted.
Jump to: Advertising · Product quality · Price reduction · Commissions · Special order · Results table · Risk check · Practice problems
Example 1: Should Adam Spend $10,000 More on Advertising?
Adam considers spending an additional $10,000 per month on advertising. Sales are expected to increase from 500 to 540 tablets, while selling price and variable cost per tablet remain unchanged.
Additional contribution margin: (540 − 500) × $200 = $8,000.
Change in operating income: $8,000 − $10,000 = −$2,000.
New operating income: 540 × $200 − $90,000 = $18,000.
The proposal reduces monthly operating income by $2,000. On the stated financial assumptions, Adam should reject it. The campaign must generate 50 additional tablet sales just to cover its $10,000 cost: $10,000 ÷ $200 = 50. The forecast of 40 additional sales falls short.
Bottom line: Spending $10,000 more on advertising to sell 40 more tablets lowers operating income by $2,000. The campaign needs at least 50 extra sales just to pay for itself.
Example 2: Is a Higher-Quality Tablet Worth a $10 Higher Unit Cost?
Adam considers purchasing an upgraded tablet model with higher-quality materials. This raises variable cost by $10 per tablet, from $300 to $310. Expected sales increase by 80 tablets, from 500 to 580, with no change in the $500 selling price or fixed costs.
New unit contribution margin: $500 − $310 = $190.
New total contribution margin: 580 × $190 = $110,200.
Change in operating income: $110,200 − $100,000 = $10,200.
New operating income: $110,200 − $80,000 = $30,200.
As a cross-check, sales revenue increases by $40,000, while variable costs increase by (580 × $310) − (500 × $300) = $29,800. Their difference is $10,200. Do not subtract the $29,800 again after calculating the contribution-margin increase; variable costs have already been deducted.
The proposal improves operating income if the forecast is achieved. Apply the extra $10 cost to all 580 tablets sold under the proposal, not only to the 80 additional tablets.
Bottom line: Paying $10 more per tablet for better quality raises operating income by $10,200 if sales grow to 580 tablets. Sales only need to reach 527 tablets to match the original $20,000 of operating income.
Example 3: Should Adam Cut the Price and Advertise More?
Adam proposes reducing the selling price by $20 to $480 and spending an additional $15,000 on monthly advertising. Expected sales increase from 500 to 650 tablets. Variable cost remains $300 per tablet.
New unit contribution margin: $480 − $300 = $180.
New total contribution margin: 650 × $180 = $117,000.
Change in operating income: ($117,000 − $100,000) − $15,000 = $2,000.
New operating income: $117,000 − $95,000 = $22,000.
Sales revenue rises from $250,000 to $312,000, an increase of $62,000. Variable costs rise by $45,000, leaving $17,000 of additional contribution margin. After the extra advertising expense, the proposal increases operating income by $2,000.
To preserve the original $20,000 operating income under this proposal, required sales are ($95,000 + $20,000) ÷ $180 = 638.89 tablets, rounded up to 639 tablets. The 650-unit forecast exceeds that threshold by only 11 tablets. See Farhat’s target profit formula and examples for this calculation method.
Bottom line: Cutting the price to $480 and adding $15,000 of advertising raises operating income by just $2,000. If sales come in 12 or more tablets below the 650 forecast, Adam earns less than he does today.
Example 4: Should Adam Replace a Salary with Sales Commissions?
Adam proposes replacing a $6,000 monthly salary with a $15 commission on every tablet sold. Expected sales increase from 500 to 750 tablets. The selling price remains $500, and the existing $300 variable cost increases to $315 per tablet after including commissions.
New unit contribution margin: $500 − $315 = $185.
New total contribution margin: 750 × $185 = $138,750.
New fixed costs: $80,000 − $6,000 = $74,000.
New operating income: $138,750 − $74,000 = $64,750.
Increase in operating income: $64,750 − $20,000 = $44,750.
An incremental check gives the same result: 250 additional tablets × $200 original contribution margin − $11,250 of commissions on all 750 tablets + $6,000 of salary savings = $44,750.
This improvement depends on achieving the forecast sales increase. It does not establish that commissions automatically motivate employees or produce higher sales. The proposal also changes the mix of fixed and variable costs; review Farhat’s explanation of cost structure and profit risk for that distinction.
Bottom line: Swapping a $6,000 salary for a $15 commission raises operating income by $44,750 if sales reach 750 tablets. That is a bold 50% jump, but the plan still beats today’s $20,000 at just 509 tablets because fixed costs fall by $6,000.
Example 5: What Price Should Adam Quote on a Special Order?
A wholesaler offers to buy 150 additional tablets. Adam wants the order to increase monthly operating income by $3,000. Assume the order does not displace regular sales, sufficient capacity is available, fixed costs do not change, and the $300 variable cost includes all additional costs of fulfilling the order.
Required contribution per tablet: $3,000 ÷ 150 = $20.
Required quoted price: $300 + $20 = $320 per tablet.
Order contribution: 150 × ($320 − $300) = $3,000.
New monthly operating income: $20,000 + $3,000 = $23,000.
The $320 price achieves the stated profit goal if the customer accepts the order. It is not a general long-term pricing rule. Additional shipping, customization, capacity costs, or lost regular sales would change the required price.
Bottom line: A $320 price on 150 special-order tablets earns $20 of contribution margin each, which adds exactly the $3,000 Adam wants, as long as fixed costs stay the same and regular sales are not lost.
How Do the Five CVP Analysis Examples Compare?
| Independent proposal | Change in monthly operating income | New monthly operating income |
|---|---|---|
| 1. Add $10,000 advertising | −$2,000 | $18,000 |
| 2. Upgrade product quality | +$10,200 | $30,200 |
| 3. Cut price and add advertising | +$2,000 | $22,000 |
| 4. Replace salary with commissions | +$44,750 | $64,750 |
| 5. Accept special order at $320 | +$3,000 | $23,000 |
The original monthly operating income is $20,000 in every comparison. These proposals use different sales forecasts, so the table does not prove that the largest projected increase is the best business decision. Managers must also assess demand, capacity, product quality, and customer relationships.
Risk Check: How Far Can Each Forecast Miss?
Projected profit is only half the story. Each proposal also changes how many tablets Adam must sell to break even and to keep today’s $20,000 of operating income. Two formulas do the work:
- Break-even units = Total fixed costs ÷ Unit contribution margin.
- Units needed for a target income = (Total fixed costs + Target operating income) ÷ Unit contribution margin.
Round both answers up to the next whole tablet. At the baseline, break-even is $80,000 ÷ $200 = 400 tablets.
| Proposal | Forecast sales | Tablets needed to keep $20,000 | Cushion (tablets the forecast can miss by) | Break-even point |
|---|---|---|---|---|
| 1. Add $10,000 advertising | 540 | 550 | −10 (falls short) | 450 |
| 2. Upgrade product quality | 580 | 527 | 53 | 422 |
| 3. Cut price and add advertising | 650 | 639 | 11 | 528 |
| 4. Replace salary with commissions | 750 | 509 | 241 | 400 |
| 5. Special order at $320 | 150 extra | Not applicable (any accepted order adds $20 per tablet) | Not applicable | 400 regular tablets (unchanged) |
Example 3 shows why this matters. It adds $2,000 of income, but its break-even point jumps from 400 to 528 tablets, and missing the forecast by just 12 tablets leaves Adam worse off than today. Example 4 moves the other way. Lower fixed costs keep break-even at 400 tablets even though each tablet now earns $185 instead of $200.
The break-even column also lets you find each proposal’s margin of safety, which is how far sales can fall before operating income hits zero. For example, Example 2’s forecast of 580 tablets sits 158 tablets above its 422-tablet break-even point. Learn more with Farhat’s margin of safety formula and examples and his guide to the degree of operating leverage.
Common CVP Analysis Mistakes
- Applying a new variable cost or commission only to additional units when it applies to every unit sold.
- Keeping the old contribution margin after changing the selling price or variable cost per unit.
- Subtracting variable costs twice after already calculating contribution margin.
- Combining independent proposals or comparing them with different starting amounts.
- Treating a sales forecast as certain or ignoring capacity limits.
- Rounding break-even or target units down. Always round up to the next whole unit. In Example 3, 638.89 tablets means Adam must sell 639 to reach his target.
CVP analysis rests on a few simplifying assumptions. Costs can be split cleanly into fixed and variable parts. Selling price and variable cost per unit stay constant within each scenario. Fixed costs stay constant within the relevant range, which is the band of activity where these cost patterns hold, except for the changes each scenario states. Units produced equal units sold, so inventory does not change, and a company selling several products keeps the same sales mix. Use the same time period throughout. These examples calculate operating income before interest and income taxes.
Practice: Try Two CVP Analysis Examples Yourself
Use Adam’s baseline: $500 selling price, $300 variable cost per tablet, 500 tablets, $80,000 of fixed costs, and $20,000 of operating income.
Question 1: Adam raises the price to $520 and expects sales to fall to 470 tablets. Variable cost and fixed costs do not change. Should he do it?
Answer: New unit contribution margin = $520 − $300 = $220. Total contribution margin = 470 × $220 = $103,400. Operating income = $103,400 − $80,000 = $23,400, an increase of $3,400. Yes, the higher price wins on these numbers even though Adam sells 30 fewer tablets. Break-even also drops to $80,000 ÷ $220 = 363.6, or 364 tablets.
Question 2: A new supplier cuts variable cost to $290 per tablet, but quality inspections add $4,000 of monthly fixed costs. Sales stay at 500 tablets. Should Adam switch?
Answer: New unit contribution margin = $500 − $290 = $210. Total contribution margin = 500 × $210 = $105,000. Operating income = $105,000 − $84,000 = $21,000, an increase of $1,000. Quick check: contribution margin rises by 500 × $10 = $5,000, and fixed costs rise by $4,000, so income rises by $1,000. Yes, it is a small gain.
Key Takeaways
- Operating income equals total contribution margin minus fixed costs. Contribution margin alone is not profit.
- To judge any proposal, compare the change in total contribution margin with the change in fixed costs.
- A new unit cost or commission applies to every unit sold, not just the extra units.
- A bigger projected profit can come with a higher break-even point and more risk.
- Always check how many units a proposal needs to beat your current income.
Frequently Asked Questions About CVP Analysis
What is the difference between contribution margin and operating income?
Contribution margin is sales revenue minus variable costs. Operating income is total contribution margin minus fixed costs. Adam’s baseline contribution margin is $100,000, but operating income is $20,000 after deducting $80,000 of fixed costs.
Can sales increase while operating income decreases?
Yes. In the advertising example, additional sales generate $8,000 of contribution margin but require $10,000 of extra fixed spending. Operating income therefore falls by $2,000 even though unit sales increase.
When is a special order below the normal selling price acceptable?
A special order can increase operating income when its additional revenue exceeds all relevant additional costs and any contribution lost from displaced sales. Check available capacity, customer effects, and any required profit target before deciding.
What is CVP analysis used for?
CVP analysis is used to predict how a business decision will change operating income before any money is spent. Managers use it to test price changes, advertising budgets, cost structure changes, special orders, and sales targets. It also finds the break-even point, the sales level where operating income is exactly zero.
What are the main assumptions of CVP analysis?
CVP analysis assumes that costs can be split into fixed and variable parts, that selling price and variable cost per unit stay constant, and that fixed costs stay constant within the relevant range. It also assumes units produced equal units sold and, for companies with several products, a constant sales mix.
How do you calculate the break-even point in CVP analysis?
Divide total fixed costs by the unit contribution margin. For Adam Electronics, $80,000 ÷ $200 = 400 tablets. At 400 tablets, contribution margin exactly covers fixed costs, so operating income is $0. If the answer has a decimal, round up to the next whole unit.
Is CVP analysis tested on the CPA and CMA exams?
Yes. The AICPA’s blueprint for the Business Analysis and Reporting (BAR) section of the CPA Exam lists breakeven analysis and what-if scenarios. The IMA’s CMA content specification lists cost-volume-profit analysis, including breakeven analysis, in Part 2 under business decision analysis, along with special orders and pricing.
Continue Learning with Farhat Lectures
Practice these decisions the same way every time: identify what changes, recalculate contribution margin, and compare operating income with the baseline. For more worked lessons, explore the Farhat Lectures Managerial Accounting course.
Studying for an exam? Try the BAR Test Bank for CPA practice questions, or the CMA Part 2 course for CMA prep. New to Farhat Lectures? Try the free sample course first.
About the Author
Mansour Farhat, CPA, CIA, DBA, is the instructor behind Farhat Lectures, where he teaches accounting courses and CPA and CMA exam topics through written lessons and YouTube videos like the one in this article.




Responses