
Cost Structure: 2 Easy Examples of Profit and Risk

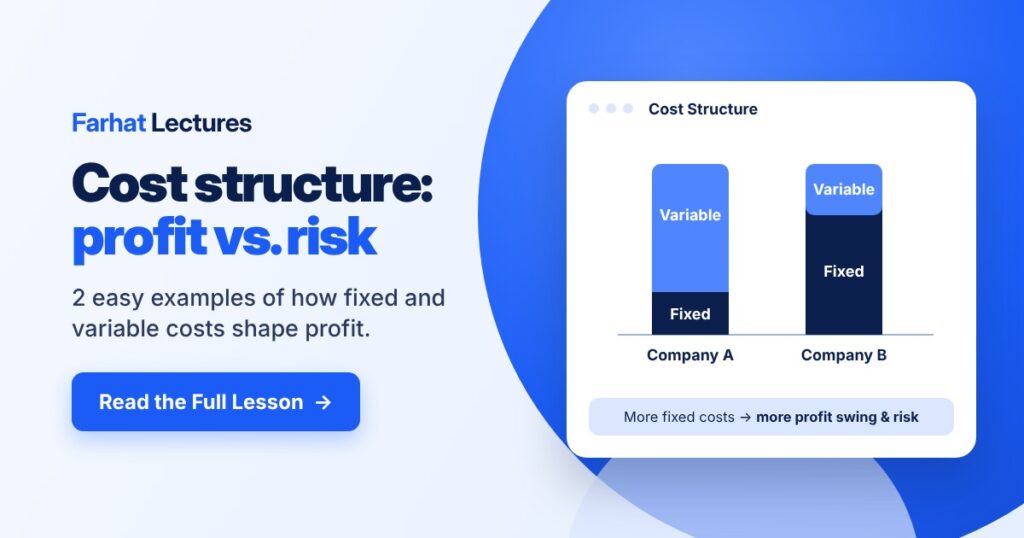
Cost structure is the mix of fixed and variable costs a business incurs. That mix helps explain why two companies with the same sales and profit can respond very differently when sales change. A business with higher fixed costs and a higher contribution margin can earn more as sales grow, but its profit can also fall faster when sales decline.
The connection is straightforward: Operating profit = Sales − Variable costs − Fixed costs. The examples below follow the same two olive oil companies through a good sales period and a slow one. Here, profit means operating income before interest and income taxes.
Cost Structure Example: Same Sales, Same Profit, Different Risk
Lean Company relies more on costs that vary with production. Big Company uses more automated equipment, giving it higher fixed costs but lower variable costs. Both start with $100,000 in sales and $10,000 in operating profit for the period.
| Income statement item | Lean Company | Big Company |
|---|---|---|
| Sales | $100,000 | $100,000 |
| Less variable costs | ($60,000) | ($30,000) |
| Contribution margin | $40,000 | $70,000 |
| Less fixed costs | ($30,000) | ($60,000) |
| Operating profit | $10,000 | $10,000 |
| Contribution margin ratio | 40% | 70% |
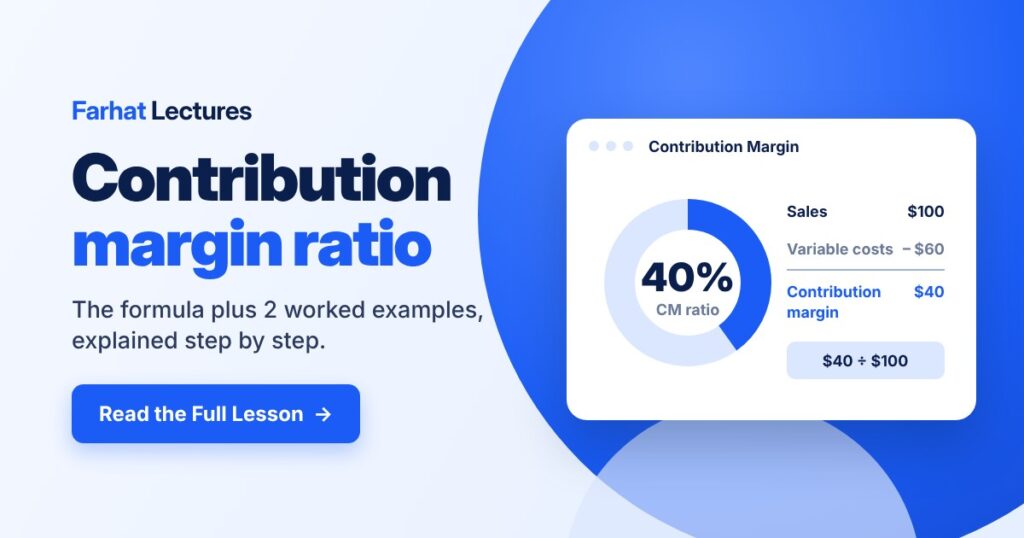
Contribution margin is sales minus variable costs. Lean keeps 40 cents of each sales dollar to cover fixed costs and then profit; Big keeps 70 cents. Their contribution margin ratios are $40,000 ÷ $100,000 = 40% and $70,000 ÷ $100,000 = 70%.
Big keeps more from each dollar sold, but it must cover twice as much in fixed costs. That tradeoff produces the same starting profit. The difference becomes visible when sales move.
Watch: What Is Cost Structure?
Follow Professor Farhat’s explanation of Lean Company and Big Company, including how a 10% sales change affects their profits, break-even points, and margin of safety.
Jump to a topic: 2:01 — two-company example · 3:24 — sales increase · 4:06 — sales decrease · 5:02 — break-even and margin of safety.
Understanding Fixed and Variable Costs
Before changing the sales numbers, separate costs by how they behave:
- Fixed costs stay constant in total within a relevant range and time period. A shop’s $2,000 monthly rent stays $2,000 whether it sells 500 or 800 bottles, provided it does not need additional space.
- Variable costs change in total with activity. If packaging costs $1 per bottle, 500 bottles cost $500 and 800 bottles cost $800. The total changes; the cost per bottle stays $1.
- Mixed costs contain both parts. A utility bill might include a fixed monthly charge plus a charge for usage. Separate these components when building a cost-volume-profit model.
Classify costs by their behavior, not just their name. Labor paid per unit may be variable, while a supervisor’s salary may be fixed over the period. Automation often adds fixed costs such as equipment leases or straight-line depreciation while reducing variable cost per unit.
For both examples, assume sales change because volume changes. Selling prices, variable cost per unit, and total fixed costs stay constant within the relevant range, and any sales mix stays unchanged.
Example 1: What Happens When Sales Increase by 10%?
Sales rise from $100,000 to $110,000. Because the contribution margin ratios remain constant, multiply the new sales by each company’s ratio, then subtract fixed costs:
- Lean Company: $110,000 × 40% = $44,000 contribution margin. Subtract $30,000 of fixed costs to get $14,000 operating profit.
- Big Company: $110,000 × 70% = $77,000 contribution margin. Subtract $60,000 of fixed costs to get $17,000 operating profit.
Check Big’s result: $110,000 sales − $33,000 variable costs − $60,000 fixed costs = $17,000 profit. Variable costs increased with volume; fixed costs did not.
Lean’s profit increases by $4,000, or 40%. Big’s profit increases by $7,000, or 70%. Big benefits more because each extra sales dollar contributes 70 cents to profit after its fixed costs are covered, compared with 40 cents for Lean.
Example 2: What Happens When Sales Decrease by 10%?
Now return to the original $100,000 sales level and assume sales fall to $90,000. This is a separate scenario, not a decline from $110,000.
- Lean Company: $90,000 × 40% − $30,000 = $6,000 operating profit.
- Big Company: $90,000 × 70% − $60,000 = $3,000 operating profit.
Lean’s profit falls by 40%, while Big’s falls by 70%. Both companies save variable costs as volume declines, but Big still has $60,000 of fixed costs to cover. The same cost structure that helped Big during growth makes its profit more sensitive during a downturn.
| Sales scenario | Lean’s profit | Big’s profit |
|---|---|---|
| 10% decrease: $90,000 | $6,000 | $3,000 |
| Starting sales: $100,000 | $10,000 | $10,000 |
| 10% increase: $110,000 | $14,000 | $17,000 |
Cost Structure, Break-Even, and Margin of Safety
The next question is how far sales can fall before each company starts losing money. Break-even sales = Fixed costs ÷ Contribution margin ratio. Use the ratio as a decimal: 40% = 0.40.
- Lean: $30,000 ÷ 0.40 = $75,000 in break-even sales.
- Big: $60,000 ÷ 0.70 = approximately $85,714.29 in break-even sales.
Margin of safety = Actual sales − Break-even sales. Divide that cushion by actual sales to express it as a percentage. Using the starting sales of $100,000:
| Measure | Lean Company | Big Company |
|---|---|---|
| Break-even sales | $75,000 | ≈ $85,714.29 |
| Margin of safety | $25,000 | ≈ $14,285.71 |
| Margin of safety percentage | 25% | ≈ 14.29% |
Lean can withstand a 25% drop in sales before reaching break-even; Big can withstand about 14.29%. This is why Lean has more stable profit in this example. Compare both fixed costs and contribution margin: higher fixed costs alone do not determine which business has the higher break-even point.
Connecting Cost Structure to Operating Leverage
Operating leverage describes how sensitive operating profit is to changes in sales volume. At a given sales level, degree of operating leverage = Contribution margin ÷ Operating profit.
At the original $100,000 of sales, Lean’s degree of operating leverage is $40,000 ÷ $10,000 = 4. Big’s is $70,000 ÷ $10,000 = 7. A 10% sales increase therefore produces a 40% profit increase for Lean and a 70% increase for Big under the stated assumptions. A 10% sales decrease works in the opposite direction.
Calculate this measure at the starting sales level; it changes as sales and profit change and is undefined when operating profit is zero. For another explanation of the relationship, see MIT’s cost structure and operating leverage lecture notes.
Which Cost Structure Is Better?
Neither structure is always better. In these examples, Big earns more above $100,000 of sales, Lean earns more below $100,000, and their profits are equal at $100,000. The choice depends on expected demand and how much sales uncertainty the business can absorb.
- When demand is strong and predictable: Higher fixed costs may be worthwhile if they meaningfully reduce variable cost per unit and the business can use the added capacity.
- When demand is uncertain: Lower fixed commitments may provide a larger cushion during slow periods, even if each sale contributes less toward profit.
- Before choosing: Compare realistic high- and low-sales scenarios, capacity limits, product quality, and cash needs. Keep every calculation in the same time period.
To build on this example, use target profit analysis to find the sales needed for a desired operating profit. For more explanations and practice, explore the Farhat Lectures Managerial Accounting course or try the free sample course.




Responses