
Cost-Volume-Profit (CVP) Analysis: Formula and Examples

Cost volume profit analysis (CVP analysis) examines how selling prices, sales volume, variable costs, and fixed costs affect operating profit. Managers use it to calculate break-even sales, estimate profit at different activity levels, and determine the sales needed to reach a profit target.
The central idea is simple: each sale first covers its variable costs. The amount left over, called contribution margin, helps cover fixed costs. Once total contribution margin exceeds fixed costs, the business earns operating profit. The contribution margin ratio expresses contribution margin as a percentage of sales.
CVP Formula: How to Calculate Operating Profit
Operating profit = Sales revenue − Variable costs − Fixed costs
For one product, the same CVP formula can be written as:
Operating profit = (Selling price per unit − Variable cost per unit) × Units sold − Fixed costs
In symbols: Operating profit = (P − V) × Q − F, where P is selling price per unit, V is variable cost per unit, Q is units sold, and F is total fixed costs for the period.
Contribution margin per unit = P − V. Therefore, operating profit also equals contribution margin per unit × units sold − fixed costs. Use the per-unit contribution margin when multiplying by units; total contribution margin has already incorporated volume.
Worked CVP Analysis Example: Adam Electronics
Adam Electronics sells 500 tablets in December for $500 each. Variable costs are $300 per tablet, and December fixed costs are $80,000. What is Adam’s operating profit, and how many tablets must it sell to break even?
Step 1: Find Contribution Margin
Each tablet contributes $500 − $300 = $200 toward fixed costs and profit. The contribution margin ratio is $200 ÷ $500 = 40%. This means 40 cents of each sales dollar remains after variable costs.
Step 2: Calculate Operating Profit
Operating profit = ($500 − $300) × 500 − $80,000 = $20,000
| December income statement | Calculation | Amount |
|---|---|---|
| Sales revenue | 500 × $500 | $250,000 |
| Less variable costs | 500 × $300 | ($150,000) |
| Contribution margin | 500 × $200 | $100,000 |
| Less fixed costs | Monthly total | ($80,000) |
| Operating profit | $100,000 − $80,000 | $20,000 |
Step 3: Calculate the Break-Even Point
At break-even, operating profit is zero because total contribution margin exactly covers fixed costs.
Break-even units = Fixed costs ÷ Contribution margin per unit
For Adam: $80,000 ÷ $200 = 400 tablets.
Break-even sales dollars = Fixed costs ÷ Contribution margin ratio
For Adam: $80,000 ÷ 0.40 = $200,000. This also equals 400 tablets × $500.
Step 4: Compare Sales Scenarios
With prices and costs unchanged, every additional tablet sold increases operating profit by $200. At 500 tablets, Adam sells 100 tablets above break-even: 100 × $200 = $20,000 of profit.
- 400 tablets: ($200 × 400) − $80,000 = $0 profit.
- 440 tablets: ($200 × 440) − $80,000 = $8,000 profit.
- 500 tablets: ($200 × 500) − $80,000 = $20,000 profit.
Common mistake: at 440 tablets, $88,000 is total contribution margin. Subtracting $80,000 of fixed costs leaves $8,000 of operating profit.
Cost Volume Profit Analysis Graph
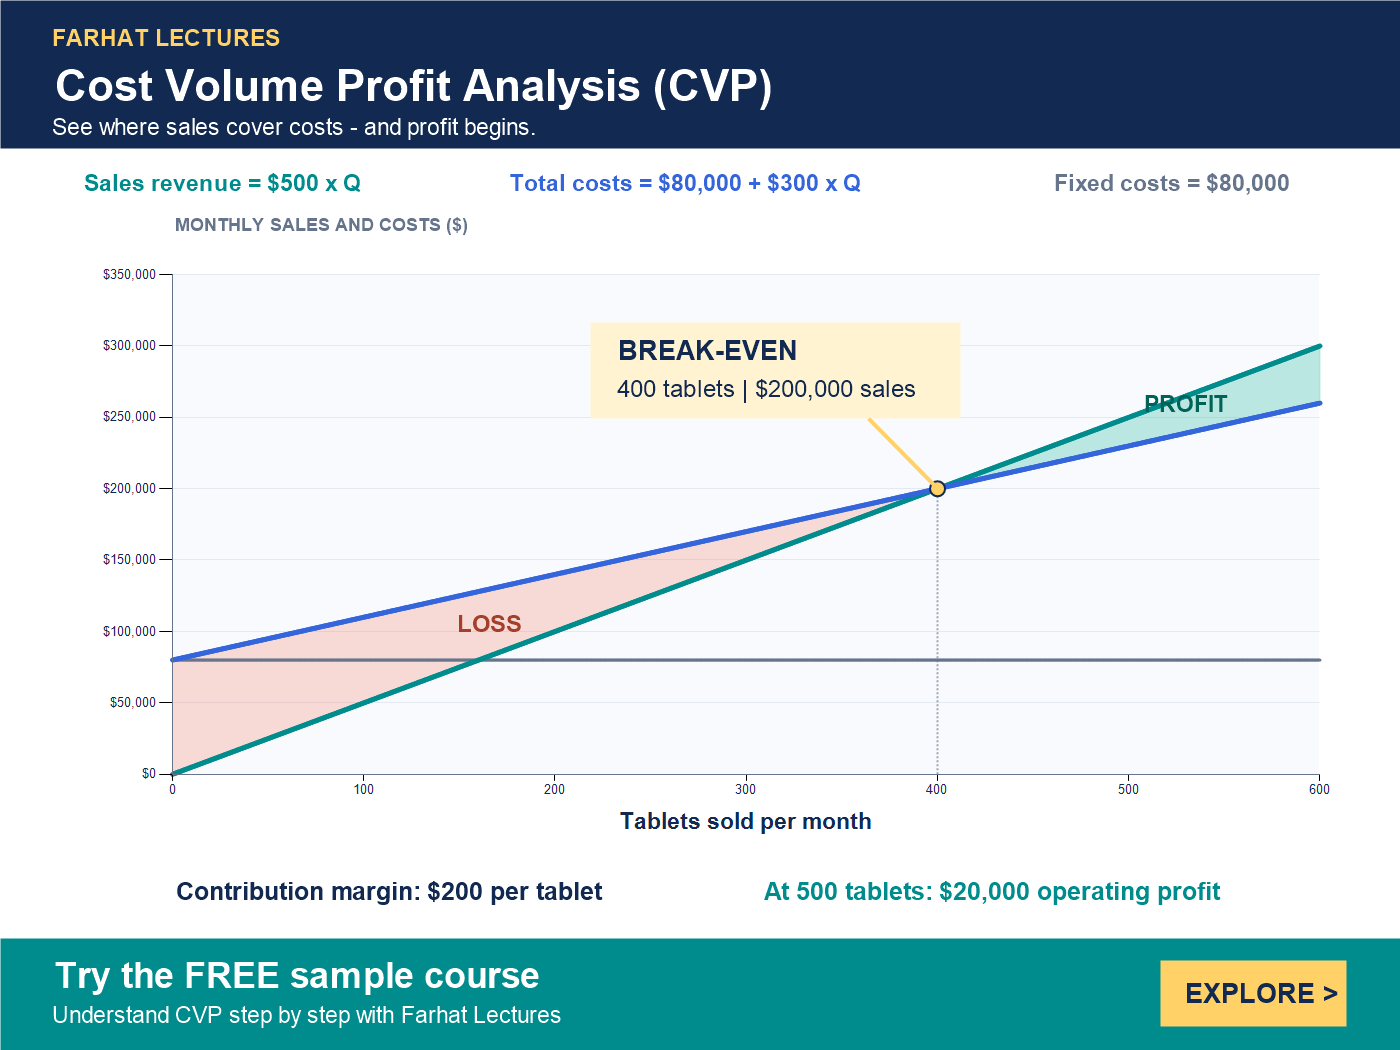
The graph shows the same cost volume profit relationships as the calculations above. Sales revenue starts at zero, while total costs start at $80,000 of fixed costs. The lines cross at break-even. To the right of that point, sales exceed total costs and the gap represents operating profit.
Watch the CVP Analysis Lecture
Review cost volume profit analysis with Farhat Lectures in this worked break-even and profit lesson. Watch the lecture on YouTube starting at 0:24, or use the video below.
The Components of Cost Volume Profit Analysis
- Selling price: revenue earned per unit sold. A price change affects contribution margin and may also affect customer demand.
- Variable costs: costs that change in total with activity, such as the cost of tablets purchased for resale. CVP assumes variable cost per unit stays constant within the relevant range.
- Fixed costs: costs that stay constant in total within a specified activity range and time period, such as monthly rent. Fixed cost per unit falls as volume rises.
- Sales volume: the number of units sold. Use sales volume, not unsold production, when calculating revenue.
- Operating profit: the amount left after variable and fixed operating costs. It is measured before interest and income taxes.
Using CVP Analysis to Reach a Target Profit
To find the required sales volume for a desired operating profit, rearrange the CVP equation:
Required units = (Fixed costs + Target operating profit) ÷ Contribution margin per unit
For a sales-dollar answer, divide the same numerator by the contribution margin ratio. A target profit of zero gives the break-even formula. See the target profit formula with worked examples for a complete before-tax and after-tax walkthrough.
CVP Assumptions and Limitations
Cost volume profit analysis is a planning model. Its results depend on the assumptions used:
- Selling price and variable cost per unit remain constant within each scenario.
- Total fixed costs remain constant within the relevant range. Expanding capacity may require a new fixed-cost estimate.
- Costs can be separated into fixed and variable components, including the components of mixed costs.
- For multiple products, the sales mix remains constant. Manufacturing examples generally assume production equals sales, so inventory does not change.
Use costs and sales for the same period, express percentages as decimals in calculations, and round required whole units up. A positive contribution margin is needed to cover positive fixed costs. CVP estimates what happens if the inputs hold; it does not predict demand.
Frequently Asked Questions About CVP Analysis
Is CVP analysis the same as break-even analysis?
Break-even analysis is one part of CVP analysis. It finds the sales level where profit is zero. CVP also evaluates target profit and the effects of changing prices, costs, or sales volume.
Is contribution margin the same as profit?
No. Contribution margin equals sales minus variable costs. Operating profit equals total contribution margin minus fixed costs. In Adam’s example, $100,000 of contribution margin leaves $20,000 of operating profit.
Does the CVP formula calculate after-tax profit?
The basic formula calculates operating profit before interest and taxes. In a simplified example with no nonoperating items, convert an after-tax target to a pretax target by dividing it by (1 − tax rate), then use the target-profit formula.
Can CVP analysis be used for several products?
Yes. Use an appropriate weighted-average contribution margin based on the expected sales mix. If that mix changes, recalculate break-even and target sales because the products may contribute different amounts toward fixed costs.
To measure how a percentage change in sales affects operating profit, use the degree of operating leverage.
For another explanation of the assumptions and break-even formulas, see OpenStax’s managerial accounting chapter on break-even analysis.
Build your understanding with the Farhat Lectures Managerial Accounting course, or try the free sample course to explore the lessons.


Responses