
CPA Exam Pass Rate by Jurisdiction: Statistics & Map

CPA exam pass rate by jurisdiction statistics compare pass rates for candidates applying through different state and territorial boards. In this 2024 dataset, Nebraska leads at 61.9%, followed by Utah at 58.6%. Montana and Wisconsin tie at 57.4%. The map and table below cover 53 jurisdictions.
Data year: 2024. These figures relate to NASBA’s 2024 Candidate Performance Report, released August 12, 2025. They are the latest complete jurisdiction dataset currently included in this guide. Last reviewed: September 29, 2026. The report’s release year and the year of exam results are different.
Jump to: Pass rate map · All 53 jurisdictions · How to read the data · Frequently asked questions
CPA Exam Pass Rate by Jurisdiction Map: 2024 Results
Use this color-coded tile map to compare CPA exam pass rates by state at a glance. Each tile includes a jurisdiction abbreviation and its percentage. Positions are schematic, not geographic boundaries. Select the image for a larger view, or use the full-name table below.
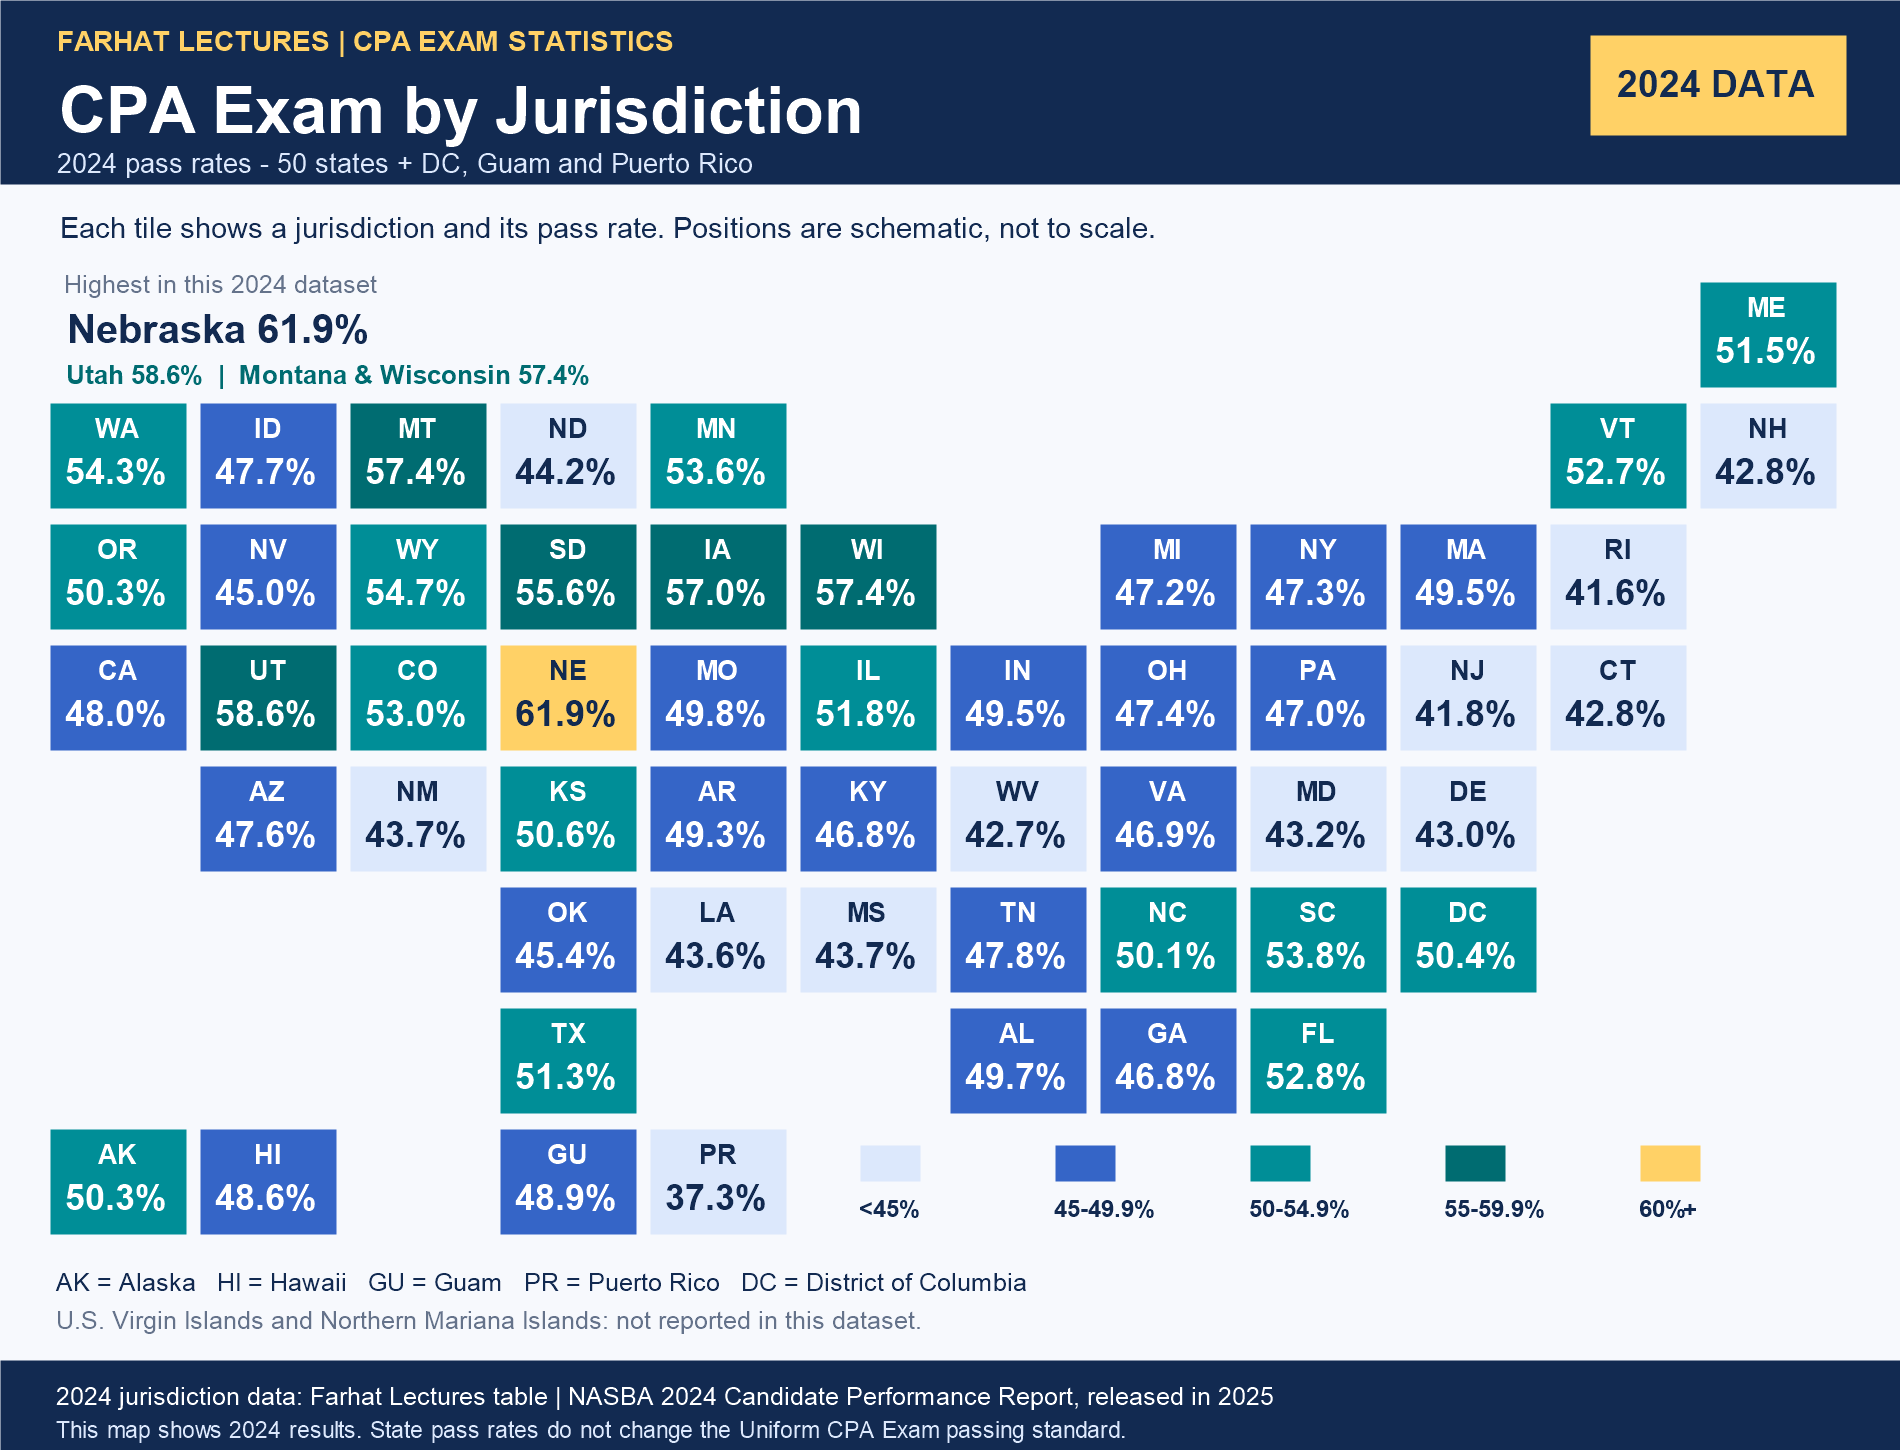
CPA Exam Pass Rate by Jurisdiction: Complete Statistics
The table includes all 50 states, the District of Columbia, Guam, and Puerto Rico. This dataset does not provide percentages for the U.S. Virgin Islands or the Northern Mariana Islands; missing values are not zero pass rates. All values below refer to 2024 results.
| Rank | Jurisdiction | 2024 pass rate |
|---|---|---|
| 1 | Nebraska | 61.9% |
| 2 | Utah | 58.6% |
| 3 | Montana | 57.4% |
| 3 | Wisconsin | 57.4% |
| 5 | Iowa | 57.0% |
| 6 | South Dakota | 55.6% |
| 7 | Wyoming | 54.7% |
| 8 | Washington | 54.3% |
| 9 | South Carolina | 53.8% |
| 10 | Minnesota | 53.6% |
| 11 | Colorado | 53.0% |
| 12 | Florida | 52.8% |
| 13 | Vermont | 52.7% |
| 14 | Illinois | 51.8% |
| 15 | Maine | 51.5% |
| 16 | Texas | 51.3% |
| 17 | Kansas | 50.6% |
| 18 | District of Columbia | 50.4% |
| 19 | Alaska | 50.3% |
| 19 | Oregon | 50.3% |
| 21 | North Carolina | 50.1% |
| 22 | Missouri | 49.8% |
| 23 | Alabama | 49.7% |
| 24 | Indiana | 49.5% |
| 24 | Massachusetts | 49.5% |
| 26 | Arkansas | 49.3% |
| 27 | Guam | 48.9% |
| 28 | Hawaii | 48.6% |
| 29 | California | 48.0% |
| 30 | Tennessee | 47.8% |
| 31 | Idaho | 47.7% |
| 32 | Arizona | 47.6% |
| 33 | Ohio | 47.4% |
| 34 | New York | 47.3% |
| 35 | Michigan | 47.2% |
| 36 | Pennsylvania | 47.0% |
| 37 | Virginia | 46.9% |
| 38 | Georgia | 46.8% |
| 38 | Kentucky | 46.8% |
| 40 | Oklahoma | 45.4% |
| 41 | Nevada | 45.0% |
| 42 | North Dakota | 44.2% |
| 43 | Mississippi | 43.7% |
| 43 | New Mexico | 43.7% |
| 45 | Louisiana | 43.6% |
| 46 | Maryland | 43.2% |
| 47 | Delaware | 43.0% |
| 48 | Connecticut | 42.8% |
| 48 | New Hampshire | 42.8% |
| 50 | West Virginia | 42.7% |
| 51 | New Jersey | 41.8% |
| 52 | Rhode Island | 41.6% |
| 53 | Puerto Rico | 37.3% |
How to Interpret CPA Exam by Jurisdiction Statistics
Jurisdiction means the board through which a candidate applies. These CPA exam by jurisdiction statistics group results by application board. It does not simply identify the physical location of a testing center. NASBA’s jurisdiction reporting groups candidates by the jurisdiction to which they applied, so these statistics should not be read as a ranking of Prometric centers.
A pass rate describes the share of reported exam sections passed. It is not the percentage of candidates who completed all four required sections, and it is not your personal probability of passing. For example, a 50% section pass rate would mean 50 passes out of 100 section attempts in that group; one candidate may contribute more than one attempt.
- Compare like with like. Use the same data year and the same measure when comparing jurisdictions. Annual results and a single quarter are different comparisons.
- Consider the mix of attempts. The balance of Core and Discipline sections, first-time attempts, and retakes can affect an aggregate rate.
- Look for context. Candidate preparation and the number of attempts matter. A small group can show more variation; this table alone does not establish why a jurisdiction ranks higher.
Does a Higher State Pass Rate Mean an Easier CPA Exam?
No. A jurisdiction’s pass rate does not change the passing standard. The Uniform CPA Examination uses a common competency standard. Candidates may receive different forms and questions, so it would be inaccurate to say everyone takes identical questions.
A passing score is 75 on a scale of 0–99, not 75% of questions answered correctly. The CPA Exam is not graded on a curve. See the AICPA’s explanation of CPA Exam scoring and pass rates for the official scoring approach.
Use the CPA exam pass rate by jurisdiction to understand historical performance. When selecting a board, check its current eligibility and licensure requirements. For preparation, focus on understanding the tested concepts, reviewing errors, and practicing the skills you need to improve.
Jurisdiction Rates and National Section Rates Answer Different Questions
This page compares 2024 CPA exam pass rates by jurisdiction. National pass rates for AUD, FAR, REG, BAR, ISC, and TCP measure performance by exam section. A national section rate for 2025 or 2026 should not be substituted for a 2024 state rate or added to this map.
Looking for CPA exam pass rates for 2025 or 2026? Visit our separate CPA exam pass rates by section guide and check the reporting period attached to each figure.
CPA Exam Pass Rate by Jurisdiction FAQ
Which jurisdiction had the highest CPA exam pass rate in 2024?
Nebraska had the highest rate in this dataset at 61.9%. Utah followed at 58.6%, while Montana and Wisconsin each recorded 57.4%.
Why does this updated article show 2024 results from a report released in 2025?
The exam year and publication year are different. NASBA released its 2024 Edition in August 2025. This guide retains that 2024 dataset until a complete replacement is incorporated, so the table and map stay on the same reporting basis.
Are these the latest jurisdiction statistics?
These are the latest complete jurisdiction figures currently included in this guide. NASBA has since announced its 2025 Edition, released in August 2026. The map here remains explicitly labeled 2024; it does not present 2025 or 2026 state results.
Can I improve my chances by testing in a state with a higher pass rate?
A higher reported state rate does not give you an easier passing standard. Your test-center location is also different from your application jurisdiction. The figures describe past outcomes for groups of candidates, not an advantage awarded to individual applicants.
Why are there 53 jurisdictions in the table?
The available table contains the 50 states plus the District of Columbia, Guam, and Puerto Rico. No percentage is supplied here for the U.S. Virgin Islands or the Northern Mariana Islands, so neither is assigned a rank or a zero value.
Prepare with Farhat Lectures
Use these CPA exam statistics as context for your study plan. Build a stronger foundation in the topics you find difficult, and work through explanations until you can apply the concepts yourself. Try the Farhat Lectures free sample course to explore the lessons.




Responses