
Cash Flow Ratios: A Simple Guide to Coverage and Free Cash Flow


Cash flow ratios compare cash from operating activities with a company’s obligations or spending. The two classic textbook ratios are current cash debt coverage (operating cash flow ÷ average current liabilities) and cash debt coverage (operating cash flow ÷ average total liabilities). Free cash flow is a related dollar amount, not a ratio. Under this lesson’s definition, it equals operating cash flow minus capital expenditures minus cash dividends.
Together, these measures help you judge liquidity (a company’s ability to pay short-term bills) and financial flexibility (its ability to handle surprises and opportunities). You will also meet the operating cash flow ratio, which divides operating cash flow by ending current liabilities. CMA Part 2 candidates know it as the “cash flow ratio,” and we calculate it below.
Video: Cash Debt Coverage and Free Cash Flow, Simplified
Watch Professor Farhat explain cash debt coverage and free cash flow, then apply the formulas to the original example below.
Watch this lesson on the Farhat Lectures YouTube channel.
Cash flow ratios: formulas and differences
Net cash provided by operating activities is the operating section’s final subtotal on the statement of cash flows, which US GAAP covers in FASB ASC Topic 230. It is sometimes abbreviated CFO, meaning cash flow from operations. Use that subtotal, not net income or the overall increase in cash. Review the indirect method cash flow example if you need to calculate it.
| Measure | Formula | Main question |
|---|---|---|
| Current cash debt coverage | Operating cash flow ÷ average current liabilities | How does annual operating cash compare with short-term obligations? |
| Cash debt coverage | Operating cash flow ÷ average total liabilities | How does annual operating cash compare with all liabilities? |
| Free cash flow: this lesson | Operating cash flow − capital expenditures − cash dividends | What remains after these specified cash uses? |
The first two results are expressed as times or percentages. The third is expressed in dollars. Despite the word “debt,” these coverage formulas use liabilities, not only interest-bearing bank loans and bonds.
Why cash flow ratios use average liabilities
Operating cash flow covers an entire period, while a balance sheet amount describes one date. A beginning-and-ending average provides a simple denominator that represents both endpoints. If a question gives both balances and asks for current cash debt coverage or cash debt coverage, use the average, not the ending balance. The operating cash flow ratio covered below is different: it usually uses ending current liabilities. Always follow the formula the question names.
Compute separate averages for current liabilities and total liabilities. Total liabilities already include current liabilities; adding current liabilities to total liabilities would double count them. For a seasonal company, two dates may miss the busy months, so treat the result as a rough guide.
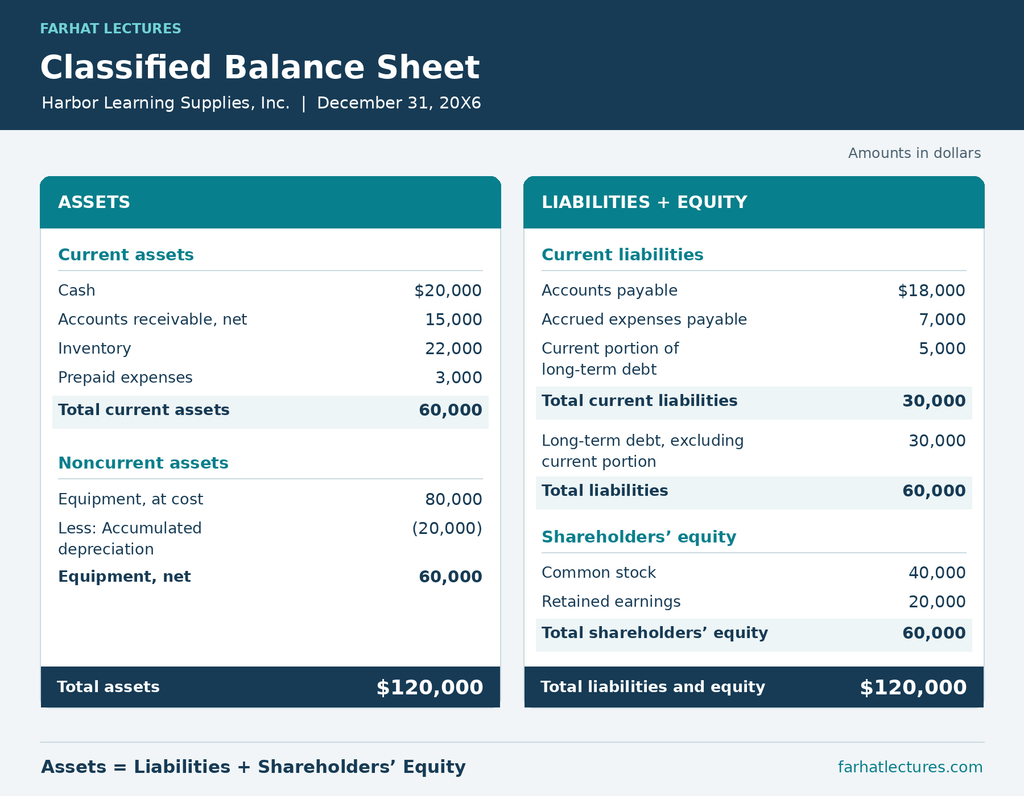
The classified balance sheet guide explains the distinction between current and noncurrent liabilities. Keep that classification separate from the operating, investing, and financing categories used on the cash flow statement.
Worked example: coverage and financial flexibility
Hypothetical example. Willow Manufacturing reports $180,000 of operating cash flow for 20X7. Current liabilities are $120,000 at the beginning and $180,000 at the end. Total liabilities are $500,000 and $700,000. Cash capital expenditures are $100,000 and cash dividends are $25,000.
| Measure | Calculation | Result |
|---|---|---|
| Average current liabilities | ($120,000 + $180,000) ÷ 2 | $150,000 |
| Current cash debt coverage | $180,000 ÷ $150,000 | 1.20 times, or 120% |
| Average total liabilities | ($500,000 + $700,000) ÷ 2 | $600,000 |
| Cash debt coverage | $180,000 ÷ $600,000 | 0.30 times, or 30% |
| Free cash flow: lesson definition | $180,000 − $100,000 − $25,000 | $55,000 |
The 1.20 result means annual operating cash flow equals $1.20 for each $1 of average current liabilities. It does not mean Willow holds $1.20 in cash at year-end for each $1 due tomorrow. The 0.30 result compares the same operating flow with the broader liability base.
A company can therefore have relatively strong current coverage while still carrying substantial long-term obligations. The $55,000 result answers a third question: how much operating cash remains after the stated capital spending and dividends. It is not an ending cash balance.
Want more practice like this? Our Intermediate Accounting course covers the statement of cash flows and the analysis that goes with it, one video lesson at a time. Preparing for CMA Part 2, where financial statement analysis is tested? See our CMA Exam Part 2 course.
Which free cash flow formula should you use?
Use the formula required by the question and label it explicitly. This Intermediate Accounting lesson deducts both capital expenditures and cash dividends. A common corporate-reporting definition deducts capital expenditures but does not deduct dividends. Under that definition, Willow would report $80,000, rather than $55,000.
The SEC’s guidance on non-GAAP financial measures, Question 102.07, explains that free cash flow has no uniform definition. A clear calculation is therefore essential when comparing companies or sources.
Capital expenditures are cash spent on productive long-lived assets, such as equipment or facilities. Do not replace them with depreciation expense. Depreciation allocates historical cost; it does not measure the current period’s cash purchases. For this introductory calculation, use the stated cash capital expenditures, not total net investing cash flow.
Even after the specified deductions, other commitments may remain, including principal payments on debt. A positive free cash flow figure does not establish that the whole amount can be spent freely. The SEC cautions against that inference.
Other cash flow ratios you will see
Search “cash flow ratios” and you will find more than the two textbook coverage ratios. Here are the ones students and CMA candidates meet most often, calculated for Willow Manufacturing. To use them, we need two more hypothetical facts: Willow’s 20X7 net sales were $1,200,000 and its net income was $150,000.
| Ratio | Formula | Willow calculation | Result |
|---|---|---|---|
| Operating cash flow ratio | Operating cash flow ÷ ending current liabilities | $180,000 ÷ $180,000 | 1.00 times |
| Cash flow margin | Operating cash flow ÷ net sales | $180,000 ÷ $1,200,000 | 15% |
| Quality of earnings (cash flow to net income) | Operating cash flow ÷ net income | $180,000 ÷ $150,000 | 1.20 times |
| Capital expenditure ratio | Operating cash flow ÷ capital expenditures | $180,000 ÷ $100,000 | 1.80 times |
Notice that the operating cash flow ratio is 1.00, while current cash debt coverage was 1.20. Same company, same year. The only difference is the denominator: ending current liabilities of $180,000 versus the $150,000 average. That is exactly why you should use the formula the question names.
Cash flow margin shows how much operating cash each sales dollar produces. For Willow, that is 15 cents.
When net income is positive, a quality of earnings ratio above 1.0 means operating cash flow was higher than net income, often because of noncash expenses like depreciation. If net income remains positive but the ratio stays below 1.0 year after year, take a closer look at receivables and inventory. The ratio is undefined when net income is zero, and negative or near-zero net income can produce misleading results. In those cases, examine the cash flow amounts and the reconciliation to net income directly.
When cash capital expenditures are positive, a capital expenditure ratio above 1.0 means operating cash flow exceeded those expenditures for the period. At 1.80, Willow generated $1.80 of operating cash flow for each $1 of capital spending. This does not establish that outside financing was unnecessary: payment timing and other cash obligations may still create financing needs.
How to interpret cash flow ratios responsibly
Higher coverage generally indicates more operating cash relative to the selected liabilities, but compare several periods and similar businesses. For current cash debt coverage and cash debt coverage, a ratio of 1.0 means annual operating cash flow equals the average liabilities in the denominator. For the operating cash flow ratio taught here, 1.0 means annual operating cash flow equals ending current liabilities. Neither result is a universal safety threshold or a guarantee about payment timing.
Investigate why a ratio changed. It may rise because collections improved, because liabilities fell, or because payments to suppliers were delayed. Negative operating cash flow can reflect losses or cash tied up in receivables and inventory. Growth can require cash, but repeated shortfalls still require an explanation.
Financial flexibility means the ability to respond to unexpected needs and opportunities. The three sections of the statement of cash flows help show whether the company is funding itself through operations, asset sales, or borrowing. A favorable cash flow ratio should be considered alongside those sources and uses.
Interactive Exercise: Operating Cash Flow and Creditor Analysis
Apply the interpretation principles behind cash flow ratios. Answer seven questions about operating cash flow, liquidity, and why creditors examine the statement of cash flows, then review your score and explanations.
Why is the statement of cash flows useful?
Think of net income as the long-term scorecard for a company’s success or failure, and cash as what keeps the company alive day to day. That is why creditors go straight to net cash provided by operating activities. It shows whether the company can pay its bills without borrowing more.
For small and newly developing companies, intermediate accounting textbooks describe cash flow as the single most important factor in survival. Larger companies still need to manage cash carefully.
What do creditors look for?
- How successfully the company generates net cash from operating activities.
- Trends in net operating cash flow over time.
- The major reasons for positive or negative net operating cash flow.
Interpretation reminder: Assess operating cash flow relative to the amount and timing of obligations. A high cash flow amount alone does not guarantee that every bill can be paid on time.
Instructions: Choose one answer for each question, then select “Check answers.” Each question is worth one point.
Answer key and explanations
- Net income measures long-term success or failure. Cash remains essential for the company’s survival.
- Cash flow is the single most important element for survival. This applies to small and newly developing companies; medium and large companies must also control cash flow.
- Creditors are concerned about being paid. They examine cash flow to understand the company’s ability to pay its bills.
- Creditors begin with net cash provided by operating activities. This is the starting point described for their examination.
- Strong operating cash flow relative to obligations may support paying bills without further borrowing. Creditors also assess payment timing, recurring cash needs, and cash flow trends.
- Low or negative operating cash flow may mean borrowing or issuing stock is necessary. The company may need these sources to obtain sufficient cash to pay its bills.
- Creditors examine generation, trends, and reasons. They investigate success in generating operating cash, trends over time, and major reasons for positive or negative amounts.
Based on the Farhat Lectures Intermediate Accounting lesson on the usefulness of the statement of cash flows.
Common mistakes to avoid
- Using net income in the numerator. These measures begin with operating cash flow.
- Using ending liabilities for the two textbook coverage ratios. Current cash debt coverage and cash debt coverage use average liabilities. The operating cash flow ratio taught here uses ending current liabilities. Follow the formula the question names.
- Confusing coverage with cash on hand. A flow over a year differs from a balance at one date.
- Mixing free cash flow definitions. State whether cash dividends were deducted.
- Calling free cash flow a ratio. The calculation above produces a dollar amount.
- Reporting cash flow per share. Under US GAAP, FASB ASC 230 does not allow financial statements to report cash flow per share, and the SEC staff says free cash flow must not be presented on a per-share basis. Exam questions love this trap.
Practice: calculate and explain
1. Operating cash flow is $96,000. Current liabilities begin at $60,000 and end at $100,000. What is current cash debt coverage?
Answer: 1.20 times. Average current liabilities are $80,000, and $96,000 ÷ $80,000 = 1.20. Using $100,000 alone would answer a different calculation.
2. Operating cash flow is $96,000 and average total liabilities are $400,000. What is cash debt coverage?
Answer: 0.24 times, or 24%. Annual operating cash equals 24% of average total liabilities. This does not mean 24% of the liabilities were actually repaid.
3. Operating cash flow is $96,000, cash capital expenditures are $70,000, and cash dividends are $12,000. What is free cash flow under this lesson’s formula?
Answer: $14,000. Subtract both specified uses: $96,000 − $70,000 − $12,000. The definition excluding dividends would instead produce $26,000.
4. Using the data from question 1, what is the operating cash flow ratio based on ending current liabilities?
Answer: 0.96 times. Divide $96,000 by ending current liabilities of $100,000. Compare that with the 1.20 current cash debt coverage from question 1: same cash flow, different denominator, different answer.
Key takeaways
- Current cash debt coverage = operating cash flow ÷ average current liabilities.
- Cash debt coverage = operating cash flow ÷ average total liabilities.
- Free cash flow is a dollar amount. This lesson subtracts capital expenditures and cash dividends; many companies subtract only capital expenditures.
- The operating cash flow ratio uses ending current liabilities, so always follow the formula the question names.
- Start every calculation with net cash provided by operating activities, never net income.
- Compare ratios over time and against similar companies. No single number guarantees that bills will be paid on time.
Frequently asked questions
Is current cash debt coverage the same as the current ratio?
No. Current cash debt coverage uses operating cash flow divided by average current liabilities. The current ratio compares current assets with current liabilities at a date.
Can free cash flow be negative when operating cash flow is positive?
Yes. Capital expenditures and dividends can exceed the operating inflow. Examine whether the spending reflects expansion, replacement needs, or unsustainable commitments.
Does a 25% cash debt coverage ratio mean all liabilities will be repaid in four years?
No. That assumes cash flow and liabilities remain unchanged and all operating cash is available for repayment. Capital spending, distributions, and other needs make that an unreliable forecast.
What is the operating cash flow ratio?
The operating cash flow ratio divides net cash provided by operating activities by current liabilities, usually the ending balance. CMA candidates know it as the “cash flow ratio.” It answers almost the same question as current cash debt coverage, which uses average current liabilities instead.
What is a good cash flow ratio?
There is no single benchmark that fits every company. Compare the result with the company’s own prior years and with similar businesses. A current cash debt coverage above 1.0 means operating cash for the year exceeded average current liabilities, which generally signals comfortable liquidity, but it is not a guarantee.
Can a company report cash flow per share?
Not in its financial statements. Under US GAAP, FASB ASC 230 prohibits reporting cash flow per share, and the SEC staff says free cash flow must not be presented on a per-share basis. This is a classic exam trap.
Is free cash flow a GAAP measure?
No. Free cash flow is a non-GAAP measure, so each company defines it. The SEC staff notes that it has no uniform definition, which is why you should always check how a company or textbook calculates it.
Sources and learning context
The SEC cash flow overview explains the operating subtotal used in these calculations. Its non-GAAP guidance addresses free cash flow definitions and interpretation. The two coverage formulas and the dividend-deducting free cash flow formula follow the definitions used in widely adopted intermediate accounting textbooks, such as Kieso, Weygandt, and Warfield’s Intermediate Accounting. The statement of cash flows itself is governed by FASB ASC Topic 230.
About the author
Mansour Farhat, CPA, CIA, DBA, is the professor behind Farhat Lectures. He teaches intermediate accounting and CPA and CMA exam topics on this site and on the Farhat Lectures YouTube channel.
CONTINUE LEARNING



Responses