
2024 California CPA Exam Score Analysis: Pass Rates, Top Schools & Strategy
1. Executive Summary: Key Trends in California CPA Exam Scores
Data from the 2024 NASBA Candidate Performance Report reveals that success on the CPA Exam in California is driven by three observable patterns: education level, candidate age, and institutional efficiency.
- The “One-and-Done” Rule: First-time test takers in this dataset consistently outperform all-events candidates. In high-volume programs, this often translates to a low-double-digit advantage, mirroring national trends where first attempts are significantly more successful than re-examinations.
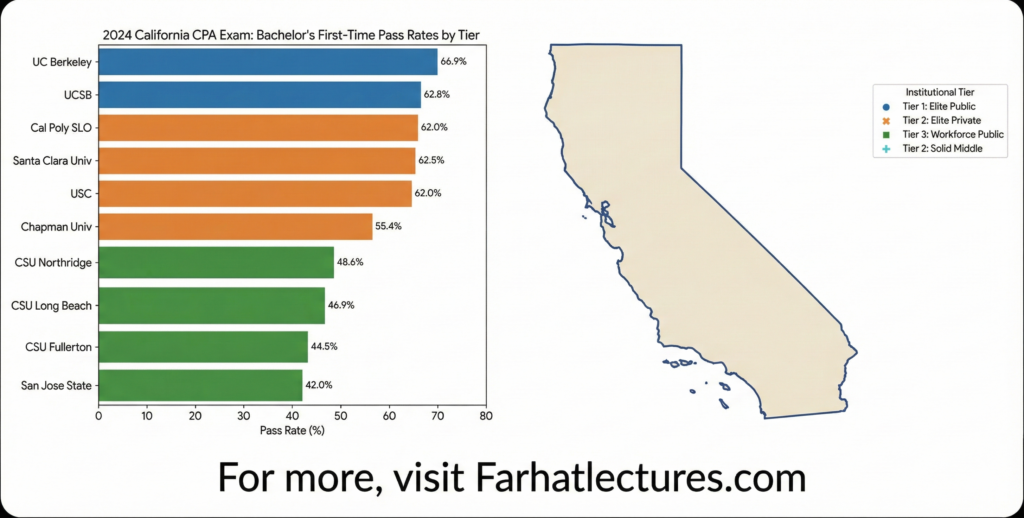
- Best CPA Schools in California: Elite Public Universities (e.g., UC Berkeley, Cal Poly SLO) achieved the highest pass rates, frequently exceeding 75% for specific cohorts.
- The Demographic Gradient: Candidates under age 26 (typically fresh graduates) show statistically higher pass rates than older cohorts. This aligns with national NASBA data, which historically reflects a steady decline in pass rates—often exceeding a letter-grade worth of difference (10+ points)—as candidates move from their early 20s into their 30s.
Data Notes & Definitions
- Dataset: 2024 NASBA Candidate Performance data for California institutions (Appendices A-2/A-3, B-2/B-3). See at the bottom of the page
- First-Time vs. Retake: “First-Time” refers to the pass rate of candidates sitting for a section for the very first time. “All-Events” includes both first-timers and retakers.
- Inferred Retake Rate: NASBA does not explicitly publish a “Retaker Only” column. However, we can estimate it using a weighted average calculation (see Structural Trends below), which suggests the implied pass rate for retakers often sits in the low-20% range.
2. Methodology & Limitations
This report analyzes observational data from California institutions. Readers should be aware of the following context:
- Observational Nature: The data identifies correlations, not causation. For example, the “Master’s Premium” may be partly driven by stronger students self-selecting into graduate programs rather than the degree itself.
- NASBA Data Context: Recent commentary has flagged inconsistencies in the 2024 Candidate Performance Report, including potential missing data rows or classification errors. Conclusions here are based on the published dataset but should be revisited if NASBA issues a revised report.
- Sample Size: Institutions with fewer than five candidates were excluded. Small cohort sizes (e.g., <10 candidates) at some elite schools can result in volatile percentages (e.g., 88% vs 100%).
3. Structural Trends: Degree Impact & The “Retake Wall”
Advanced Degree vs. Bachelor’s: The “Master’s Premium”
Advanced degree candidates in California consistently show higher pass rates than their Bachelor’s-only counterparts.
- The Data: In this dataset, Advanced Degree cohorts often outperformed Bachelor’s cohorts by roughly 10–15 percentage points on first attempts.
- Interpretation: This premium suggests that the structured environment of a master’s program—often acting as a “boot camp” for the exam—helps candidates clear the 150-hour rule while prepping for core sections like FAR and AUD.
The “Retake Wall”: Diminishing Returns
Pass rates drop measurably for candidates re-taking sections, creating a statistical “wall.”
- The Drop-off: At major workforce schools (e.g., CSU Fullerton, CSU Northridge), the All-Events pass rate trails the First-Time rate by roughly 5–10%.
- Implied Retake Math: While NASBA does not report retake scores directly, we can infer them.
- Example Calculation: Suppose a program has a 45% First-Time Pass Rate but a 40% All-Events Pass Rate. If the candidate pool is roughly 60% first-timers and 40% retakers, the retaker pass rate must be significantly lower (mathematically ~32%) to drag the average down that far. In programs with heavier retake volumes, this implied rate frequently drops into the low-20s.
- Implication: This severe drop-off underscores that simply re-taking the exam without changing study habits is statistically inefficient.
4. Institutional Analysis: Rankings & System Deep Dives
California Accounting Program Tiers
Note: Tiers are analytic groupings based on 2024 Exam performance volume and pass efficiency.
| Tier | Profile | Example Schools | Performance (First-Time Est.) | Key Notes |
| 1. Elite Publics | High Efficiency, High ROI | Cal Poly SLO, UC Berkeley, UCSB | 60% – 90%+ | Combine “Ivy” outcomes with public tuition. |
| 2. Elite Privates | High Quality, High Cost | USC, Santa Clara, Chapman | 55% – 70% | Strong Big 4 recruiting; slightly trail Tier 1 ceilings. |
| 3. Workforce Engines | High Volume, Broad Access | CSU Fullerton, Northridge, San Diego St. | 40% – 50% | Produce the most CPAs; success is individually driven. |
| 4. Non-Traditional | Adult Learner Focus | Golden Gate Univ, National Univ | 30% – 40% | Serve working adults; face structural time headwinds. |
System Deep Dive: UC vs. CSU Performance
Data reveals massive disparities within each system. System-wide labels can be misleading.
A. University of California (UC) Stratification
| Campus Tier | Approx. Pass Rate | Examples | Context |
| Elite | 60% – 90%+ | Berkeley (92.9% Adv), UCLA (69.8% Bach), UCSB (62.5% Bach) | Top-tier performance; highly selective. |
| Mid-Tier | 45% – 55% | UC Davis, UC Irvine | Solid performance; statistically similar to top CSUs. |
| At-Risk | < 40% | UC Riverside, UC Merced | Struggle structurally; face higher statistical headwinds. |
B. California State University (CSU) Stratification
| Campus Tier | Approx. Pass Rate | Examples | Context |
| The Unicorn | 60% – 75%+ | Cal Poly SLO | Outperforms most UCs; highest ROI in the system. |
| Engines | 40% – 50% | CSU Northridge, Fullerton | Massive volume (300+ candidates); reliable talent hubs. |
| Commuter | < 35% | Dominguez Hills, San Bernardino | Lower rates reflect working-student population challenges. |
5. Demographic Analysis: The “Freshness” Advantage
- The Sweet Spot (Under 26): Candidates aged 24–26 show a statistically significant advantage. This cohort benefits from “academic freshness”—concepts from college are still active memory—and generally higher “study stamina.”
- The “Over 30” Challenge: Pass rates typically decline to the 30–40% range for candidates over 30.
- National Context: This aligns with broader industry data showing a consistent 10–20 point gap between candidates in their early 20s and those in their 30s.
- Note: This is likely not due to ability, but to structural constraints: full-time jobs, childcare, and time elapsed since graduation make the high-volume study hours required for the CPA Exam harder to secure.
6. Action Playbook: Strategic Guide for 2024
For Candidates
- [ ] Go Fast: Schedule your first section (FAR or AUD) within 6 months of graduation. Leveraging the “freshness” advantage can be worth a letter-grade lift in your score potential.
- [ ] Break the Loop: If you fail, recognize that the “low-20%” implied retake rate suggests your current method failed. Do not simply re-watch the same videos.
- Tactic: Invest in a supplemental resource (e.g., Farhat Lectures) to rebuild conceptual understanding (“why it works”) rather than just memorizing test mechanics (“how to answer”).
- [ ] Resource Allocation: If attending a Tier 3/4 campus, budget for external review support starting junior year. You cannot rely solely on coursework to bridge the gap to licensure.
For Firms
- [ ] Filter by Velocity: In Tier 3 schools, look for “Time to First Section” (did they sit within 6 months of graduating?) as a stronger predictor of success than GPA alone.
- [ ] Support “At-Risk” Hires: For older or non-traditional hires, the biggest barrier is time, not intelligence.
- Action: Provide protected study hours during non-busy seasons to offset the structural disadvantages of working candidates.
- Action: Offer stipends specifically for supplemental coaching for staff stuck in the “retake loop.”
Appendix A-2: Advanced Degree – All Testing Events 2024 (Sorted by Pass Rate)
| Institution | Cand Total | Secs Total | Secs FT Total | Secs RE Total | Pass Rate | Average Score | Average Age |
| University of California – Berkeley | 8 | 17 | 14 | 3 | 88.20% | 82.4 | 41.1 |
| Biola University | 7 | 16 | 10 | 6 | 81.30% | 78.6 | 26.8 |
| University of California – Los Angeles | 16 | 37 | 28 | 9 | 67.60% | 76.4 | 38.2 |
| California Poly State University – San Luis Obispo | 31 | 63 | 43 | 20 | 65.10% | 74.8 | 25.7 |
| California Lutheran University | 10 | 19 | 15 | 4 | 63.20% | 70.4 | 32.9 |
| Chapman University | 13 | 24 | 20 | 4 | 58.30% | 68.4 | 30.2 |
| University of San Diego | 31 | 63 | 48 | 15 | 55.60% | 68.6 | 28.3 |
| University of Southern California | 154 | 297 | 205 | 92 | 55.60% | 73.1 | 28.1 |
| San Diego State University | 98 | 198 | 140 | 58 | 54.50% | 72.1 | 29.9 |
| San Francisco State University | 37 | 77 | 47 | 30 | 54.50% | 69.3 | 31.8 |
| Woodbury University | 8 | 13 | 9 | 4 | 53.80% | 70.1 | 34.2 |
| California State University – Fullerton | 79 | 153 | 98 | 55 | 50.30% | 70.4 | 32.7 |
| Pacific States University | 7 | 12 | 9 | 3 | 50.00% | 65.6 | 36.3 |
| University of California – Davis | 73 | 140 | 97 | 43 | 49.30% | 70.7 | 28.3 |
| California Baptist University | 16 | 31 | 21 | 10 | 48.40% | 67.8 | 33.1 |
| University of California – Irvine | 117 | 207 | 146 | 61 | 48.30% | 68.3 | 28.9 |
| San Jose State University | 50 | 103 | 64 | 39 | 47.60% | 69.4 | 32 |
| National University | 20 | 40 | 26 | 14 | 47.50% | 68.7 | 37.4 |
| University of California – San Diego | 60 | 131 | 95 | 36 | 46.60% | 69.1 | 26.7 |
| California State University – San Bernardino | 33 | 57 | 39 | 18 | 43.90% | 65.5 | 34.3 |
| Golden Gate University – San Francisco | 84 | 171 | 95 | 76 | 43.90% | 70 | 39.2 |
| Azusa Pacific University | 9 | 16 | 2 | 14 | 43.80% | 69.3 | 31.3 |
| University of San Francisco | 10 | 16 | 13 | 3 | 43.80% | 60.1 | 29.8 |
| California State University – Long Beach | 46 | 87 | 46 | 41 | 42.50% | 68.8 | 31 |
| California State University – East Bay | 26 | 50 | 30 | 20 | 42.00% | 66.8 | 32 |
| California State University – Los Angeles | 32 | 62 | 37 | 25 | 40.30% | 68.5 | 36.8 |
| California State University – Sacramento | 39 | 95 | 58 | 37 | 38.90% | 70.3 | 35.7 |
| Dominican University of California | 6 | 8 | 7 | 1 | 37.50% | 57.8 | 28.8 |
| Pepperdine University | 6 | 16 | 13 | 3 | 37.50% | 68.7 | 34.3 |
| University of La Verne | 26 | 59 | 32 | 27 | 37.30% | 64.8 | 33.7 |
| California State Poly Univ – Pomona | 35 | 63 | 40 | 23 | 36.50% | 68.2 | 32.4 |
| California State University – Northridge | 54 | 96 | 62 | 34 | 36.50% | 66.2 | 33.5 |
| Saint Mary’s College of California | 25 | 55 | 36 | 19 | 36.40% | 67.1 | 32.5 |
| University of California – Riverside | 44 | 75 | 49 | 26 | 34.70% | 64.6 | 28.8 |
| California State University – Dominguez Hills | 5 | 9 | 4 | 5 | 33.30% | 65.4 | 38.4 |
| Santa Clara University | 7 | 15 | 10 | 5 | 33.30% | 64.1 | 31.7 |
| University of Redlands | 6 | 12 | 7 | 5 | 33.30% | 64.8 | 42.9 |
| Brandman University | 5 | 8 | 6 | 2 | 25.00% | 65.5 | 41.3 |
| University of the Pacific | 17 | 27 | 14 | 13 | 18.50% | 59.1 | 29.2 |
Appendix A-3: Bachelor Degree – All Testing Events 2024 (Sorted by Pass Rate)
| Institution | Pass Rate | Cand Total | Secs Total | Secs FT Total | Secs RE Total | Average Score | Average Age |
| Pepperdine University | 72.7% | 5 | 11 | 1 | 10 | 76.6 | 28.8 |
| University of California – Los Angeles | 64.8% | 213 | 438 | 334 | 104 | 75.8 | 27.4 |
| University of California – Santa Barbara | 59.2% | 331 | 639 | 475 | 164 | 73.3 | 25.6 |
| University of California – Berkeley | 57.0% | 123 | 249 | 177 | 72 | 72.4 | 29.5 |
| California Poly State University – San Luis Obispo | 56.8% | 213 | 410 | 287 | 123 | 73.0 | 26.2 |
| Santa Clara University | 56.0% | 107 | 232 | 148 | 84 | 72.5 | 25.6 |
| University of Southern California | 54.9% | 144 | 288 | 192 | 96 | 72.0 | 27.9 |
| Chapman University | 52.3% | 49 | 86 | 65 | 21 | 69.7 | 26.0 |
| University of California – Davis | 48.0% | 138 | 273 | 188 | 85 | 69.8 | 26.6 |
| University of California – Irvine | 46.2% | 186 | 379 | 265 | 114 | 67.9 | 27.2 |
| University of San Diego | 43.4% | 62 | 122 | 79 | 43 | 67.2 | 26.9 |
| California State University – Long Beach | 44.2% | 218 | 414 | 260 | 154 | 68.2 | 30.1 |
| California State University – Northridge | 42.1% | 352 | 699 | 449 | 250 | 67.7 | 30.9 |
| Saint Mary’s College of California | 42.1% | 11 | 19 | 15 | 4 | 64.3 | 27.7 |
| California State University – Fullerton | 40.1% | 464 | 898 | 589 | 309 | 67.7 | 29.1 |
| San Diego State University | 39.5% | 197 | 352 | 252 | 100 | 67.0 | 28.9 |
| San Jose State University | 36.2% | 252 | 472 | 286 | 186 | 65.9 | 30.5 |
| University of California – Riverside | 35.9% | 84 | 156 | 107 | 49 | 66.5 | 26.3 |
| Azusa Pacific University | 33.3% | 9 | 15 | 11 | 4 | 61.7 | 28.0 |
| California State University – Sacramento | 32.8% | 115 | 247 | 168 | 79 | 65.1 | 30.3 |
| California State Poly Univ – Pomona | 31.5% | 178 | 346 | 221 | 125 | 65.1 | 30.1 |
| California State University – Los Angeles | 30.6% | 86 | 157 | 108 | 49 | 64.0 | 30.9 |
| University of San Francisco | 29.4% | 23 | 51 | 32 | 19 | 62.5 | 28.4 |
| California State University – Dominguez Hills | 28.6% | 14 | 21 | 17 | 4 | 57.0 | 31.6 |
| National University | 28.6% | 12 | 21 | 16 | 5 | 62.1 | 39.4 |
| Golden Gate University – San Francisco | 25.0% | 7 | 12 | 8 | 4 | 57.8 | 41.4 |
| California State University – San Bernardino | 24.1% | 86 | 162 | 104 | 58 | 62.3 | 29.5 |
| California State University – East Bay | 23.2% | 57 | 112 | 77 | 35 | 62.1 | 31.3 |
Appendix B-3: Bachelor’s Degree – First-Time Testing Events 2024 (California)
| Institution | Cand Total FT | Secs Total FT | Pass Rate | Average Score | Average Age |
| Claremont McKenna College | 5 | 10 | 70.00% | 79 | 30.5 |
| University of California – Los Angeles | 190 | 334 | 69.80% | 77.5 | 26.3 |
| University of California – Berkeley | 105 | 177 | 65.50% | 73.7 | 29.1 |
| The Master’s University | 15 | 26 | 65.40% | 77.8 | 24.8 |
| University of La Verne | 12 | 20 | 65.00% | 73.1 | 30.8 |
| Santa Clara University | 85 | 148 | 62.80% | 73.9 | 24.5 |
| University of California – Santa Barbara | 281 | 475 | 62.50% | 74.1 | 24.9 |
| University of Southern California | 113 | 192 | 62.00% | 73.8 | 27.1 |
| California Poly State University – San Luis Obispo | 173 | 287 | 61.30% | 73.8 | 25.5 |
| Humboldt State University | 8 | 10 | 60.00% | 72.4 | 32.3 |
| Point Loma Nazarene University | 17 | 28 | 57.10% | 74 | 25.5 |
| Chapman University | 41 | 65 | 55.40% | 72 | 25.1 |
| University of California – San Diego | 130 | 190 | 53.20% | 69.4 | 28.3 |
| California State University – San Marcos | 63 | 82 | 52.40% | 71.4 | 31.2 |
| University of California – Santa Cruz | 67 | 107 | 51.40% | 69.7 | 28.3 |
| California State University – Chico | 57 | 83 | 49.40% | 70.9 | 28.9 |
| California State University – Northridge | 279 | 449 | 48.60% | 68.6 | 30.4 |
| University of California – Davis | 98 | 152 | 48.00% | 67.9 | 26 |
| California State University – Long Beach | 174 | 260 | 46.90% | 68.8 | 29.1 |
| Foothill College | 7 | 13 | 46.20% | 65.5 | 24 |
| University of California – Irvine | 170 | 290 | 46.20% | 70.4 | 26 |
| University of Redlands | 19 | 26 | 46.20% | 73.3 | 26.5 |
| Menlo College | 12 | 20 | 45.00% | 66.5 | 25.9 |
| California State University – Sacramento | 104 | 150 | 44.70% | 67 | 28.8 |
| California State University – Fullerton | 376 | 589 | 44.50% | 68.2 | 28.6 |
| National University | 9 | 16 | 43.80% | 61 | 39.4 |
| University of San Diego | 62 | 106 | 43.40% | 68.7 | 25.9 |
| California State University – Fresno | 120 | 180 | 42.80% | 66.4 | 28.4 |
| California State University – Monterey Bay | 23 | 33 | 42.40% | 68.5 | 28.5 |
| Biola University | 16 | 19 | 42.10% | 64.9 | 24.7 |
| San Diego State University | 171 | 252 | 42.10% | 66.4 | 28.6 |
| San Jose State University | 190 | 286 | 42.00% | 66.4 | 29.1 |
| California State University – Los Angeles | 83 | 125 | 41.60% | 66.8 | 33.6 |
| California Baptist University | 11 | 15 | 40.00% | 67.1 | 30.1 |
| California State University – Bakersfield | 40 | 68 | 39.70% | 63.1 | 28.8 |
| California State University – East Bay ( | 78 | 119 | 39.50% | 64.1 | 34 |
| San Francisco State University | 89 | 142 | 39.40% | 66.1 | 30.2 |
| California State Poly Univ – Pomona | 110 | 145 | 38.60% | 64.6 | 29.1 |
| University of California – Riverside | 114 | 160 | 35.60% | 64.5 | 26.8 |
| Azusa Pacific University | 12 | 15 | 33.30% | 62.9 | 26.3 |
| University of San Francisco | 34 | 45 | 33.30% | 62.4 | 27.1 |
| California State University – San Bernardino | 40 | 52 | 32.70% | 61.7 | 33.1 |
| Sonoma State University | 68 | 107 | 31.80% | 62.7 | 28 |
| Santa Monica College | 5 | 10 | 30.00% | 69.2 | 28.3 |
| California State University – Dominguez Hills | 25 | 34 | 29.40% | 58 | 31.6 |
| Saint Mary’s College of California | 20 | 31 | 29.00% | 61.7 | 28.4 |
| Woodbury University | 5 | 7 | 28.60% | 68.6 | 32.6 |
| University of California – Merced | 11 | 26 | 26.90% | 60.5 | 27 |
| California Lutheran University | 19 | 31 | 25.80% | 59.1 | 25.2 |
| California State University – Channel Islands | 5 | 5 | 20.00% | 61.2 | 32.6 |
| California State University – Stanislaus | 45 | 63 | 19.00% | 58.8 | 29.1 |
| Fresno Pacific University | 6 | 12 | 0.00% | 58.2 | 27.5 |
Appendix B-2: Advanced Degree – First-Time Testing Events 2024 (California)
| Institution | Cand Total FT | Secs Total FT | Pass Rate | Average Score | Average Age |
| University of California – Berkeley | 7 | 14 | 92.90% | 84.4 | 41.1 |
| California Poly State University – San Luis Obispo | 28 | 43 | 76.70% | 77.1 | 24.6 |
| California Lutheran University | 9 | 15 | 73.30% | 74.1 | 32.5 |
| University of California – Los Angeles | 13 | 28 | 71.40% | 77.5 | 34 |
| Chapman University | 12 | 20 | 65.00% | 68.7 | 29.8 |
| University of Southern California | 124 | 205 | 64.90% | 75.2 | 27.9 |
| San Jose State University | 36 | 64 | 59.40% | 73.2 | 30.3 |
| San Diego State University | 84 | 140 | 59.30% | 72.6 | 29.7 |
| University of San Diego | 26 | 48 | 58.30% | 69.5 | 27.6 |
| California State University – Fullerton | 66 | 98 | 56.10% | 73 | 32.7 |
| San Francisco State University | 30 | 47 | 53.20% | 70.3 | 31.3 |
| Golden Gate University – San Francisco | 63 | 95 | 52.60% | 72.4 | 39.1 |
| University of California – Davis | 59 | 97 | 52.60% | 70.9 | 27.9 |
| University of California – San Diego | 56 | 95 | 49.50% | 69.7 | 27.1 |
| California Baptist University | 14 | 21 | 47.60% | 66.4 | 31.7 |
| University of California – Irvine | 96 | 146 | 47.30% | 68.2 | 28 |
| University of La Verne | 21 | 32 | 46.90% | 67.7 | 32.8 |
| National University | 16 | 26 | 46.20% | 68.8 | 36.3 |
| California State University – Los Angeles | 27 | 37 | 45.90% | 68.8 | 36.9 |
| Pacific States University | 5 | 9 | 44.40% | 61.7 | 36 |
| Woodbury University | 7 | 9 | 44.40% | 70.2 | 33.1 |
| Saint Mary’s College of California | 22 | 36 | 41.70% | 68.3 | 33.6 |
| California State University – Sacramento | 31 | 58 | 41.40% | 70.9 | 33.5 |
| Pepperdine University | 6 | 13 | 38.50% | 68.2 | 34.1 |
| University of San Francisco | 9 | 13 | 38.50% | 58.2 | 30.6 |
| California State University – East Bay | 20 | 30 | 36.70% | 64.9 | 32 |
| California State Poly Univ – Pomona | 28 | 40 | 35.00% | 66.5 | 31.3 |
| California State University – Long Beach | 34 | 46 | 34.80% | 66.8 | 29 |
| University of California – Riverside | 33 | 49 | 34.70% | 63.3 | 28.6 |
| California State University – San Bernardino | 27 | 39 | 33.30% | 63 | 34.2 |
| California State University – Northridge | 42 | 62 | 32.30% | 64 | 33 |
| Santa Clara University | 6 | 10 | 30.00% | 63 | 32.7 |
| Dominican University of California | 6 | 7 | 28.60% | 54.4 | 28 |
| University of Redlands | 5 | 7 | 14.30% | 62.7 | 44.3 |
| University of the Pacific | 13 | 14 | 14.30% | 57.6 | 26.8 |

Responses